Opportunity awaits!! Investor special! 3 beds 1 bath ranch home. Was previously rehabbed. Fire damage. 150 ish ARV
Pending
Price cut: $10K (9/30)
$40,000
332 N Cedar Ave, Independence, MO 64053
3beds
1,068sqft
Single Family Residence
Built in 1950
8,491 Square Feet Lot
$-- Zestimate®
$37/sqft
$-- HOA
What's special
- 51 days
- 78
- 7
Likely to sell faster than
Zillow last checked:
Listing updated:
Listed by:
Wendy Linebaugh 816-769-5385,
ReeceNichols - Lees Summit,
Rob Ellerman Team 816-304-4434,
ReeceNichols - Lees Summit
Source: Heartland MLS as distributed by MLS GRID,MLS#: 2642405
Facts & features
Interior
Bedrooms & bathrooms
- Bedrooms: 3
- Bathrooms: 1
- Full bathrooms: 1
Heating
- Other
Cooling
- Other
Features
- Basement: Other
- Number of fireplaces: 1
Interior area
- Total structure area: 1,068
- Total interior livable area: 1,068 sqft
- Finished area above ground: 1,068
- Finished area below ground: 0
Property
Parking
- Parking features: Off Street
Lot
- Size: 8,491 Square Feet
- Features: City Limits, City Lot
Details
- Parcel number: 14720042600000000
Construction
Type & style
- Home type: SingleFamily
- Architectural style: Traditional
- Property subtype: Single Family Residence
Materials
- Wood Siding
- Roof: Composition
Condition
- Year built: 1950
Utilities & green energy
- Sewer: Public Sewer
- Water: City/Public - Verify
Community & HOA
Community
- Subdivision: Mc Elroy Heights
HOA
- Has HOA: No
Location
- Region: Independence
Financial & listing details
- Price per square foot: $37/sqft
- Tax assessed value: $78,240
- Annual tax amount: $1,087
- Date on market: 9/15/2026
- Listing terms: Cash,Conventional
- Exclusions: Everything
- Ownership: Investor
Estimated market value
Not available
Estimated sales range
Not available
Not available
Price history
| Date | Event | Price |
|---|---|---|
| 10/7/2026 | Pending sale | $40,000$37/sqft |
Source:  Heartland MLS as distributed by MLS GRID #2642405 Report a problem | ||
| 9/30/2026 | Price change | $40,000-20%$37/sqft |
Source: Heartland MLS as distributed by MLS GRID #2642405 Report a problem | ||
| 9/15/2026 | Listed for sale | $50,000-63.6%$47/sqft |
Source: Heartland MLS as distributed by MLS GRID #2642405 Report a problem | ||
| 1/12/2026 | Listing removed | $1,174$1/sqft |
Source: Zillow Rentals Report a problem | ||
| 12/4/2025 | Price change | $1,174-4.1%$1/sqft |
Source: Zillow Rentals Report a problem | ||
| 12/2/2025 | Price change | $1,224-5.8%$1/sqft |
Source: Zillow Rentals Report a problem | ||
| 11/27/2025 | Listed for rent | $1,299-7%$1/sqft |
Source: Zillow Rentals Report a problem | ||
| 10/20/2025 | Listing removed | $1,397$1/sqft |
Source: Zillow Rentals Report a problem | ||
| 10/19/2025 | Listed for rent | $1,397+21.1%$1/sqft |
Source: Zillow Rentals Report a problem | ||
| 10/3/2023 | Listing removed | -- |
Source: Zillow Rentals Report a problem | ||
| 9/19/2023 | Price change | $1,154-8%$1/sqft |
Source: Zillow Rentals Report a problem | ||
| 9/12/2023 | Price change | $1,254-7.4%$1/sqft |
Source: Zillow Rentals Report a problem | ||
| 9/6/2023 | Price change | $1,354-6.9%$1/sqft |
Source: Zillow Rentals Report a problem | ||
| 8/16/2023 | Price change | $1,454+7.6%$1/sqft |
Source: Zillow Rentals Report a problem | ||
| 8/14/2023 | Price change | $1,351-3.6%$1/sqft |
Source: Zillow Rentals Report a problem | ||
| 8/12/2023 | Price change | $1,401+9.9%$1/sqft |
Source: Zillow Rentals Report a problem | ||
| 6/11/2023 | Price change | $1,275-9%$1/sqft |
Source: Zillow Rentals Report a problem | ||
| 4/7/2023 | Listed for rent | $1,401$1/sqft |
Source: Zillow Rentals Report a problem | ||
| 3/21/2023 | Listing removed | -- |
Source:  ReeceNichols Real Estate Report a problem | ||
| 3/10/2023 | Price change | $137,500-8.3%$129/sqft |
Source: Heartland MLS as distributed by MLS GRID #2423787 Report a problem | ||
| 3/3/2023 | Listed for sale | $150,000+37.6%$140/sqft |
Source: Heartland MLS as distributed by MLS GRID #2423787 Report a problem | ||
| 9/28/2022 | Sold | -- |
Source: Heartland MLS as distributed by MLS GRID #2404348 Report a problem | ||
| 9/21/2022 | Contingent | $109,000$102/sqft |
Source: Heartland MLS as distributed by MLS GRID #2404348 Report a problem | ||
| 9/17/2022 | Listed for sale | $109,000-12.8%$102/sqft |
Source: Heartland MLS as distributed by MLS GRID #2404348 Report a problem | ||
| 8/21/2022 | Listing removed | -- |
Source: Heartland MLS as distributed by MLS GRID #2397473 Report a problem | ||
| 8/6/2022 | Listed for sale | $125,000$117/sqft |
Source: Heartland MLS as distributed by MLS GRID #2397473 Report a problem | ||
| 8/18/2017 | Sold | -- |
Source: Public Record Report a problem | ||
Public tax history
| Year | Property taxes | Tax assessment |
|---|---|---|
| 2025 | $1,087 +15.1% | $14,866 +12.2% |
| 2024 | $945 +2.5% | $13,252 |
| 2023 | $922 +176.9% | $13,252 +203.2% |
| 2022 | $333 +0.4% | $4,370 |
| 2021 | $332 +6.6% | $4,370 +9.5% |
| 2020 | $311 -64.2% | $3,990 -64.7% |
| 2019 | $868 | $11,303 +14.9% |
| 2018 | $868 +8% | $9,836 |
| 2017 | $804 +3.8% | $9,836 +2.6% |
| 2016 | $775 +4.8% | $9,591 +3% |
| 2014 | $739 +0.6% | $9,311 |
| 2013 | $735 +1.2% | $9,311 |
| 2012 | $726 +22.6% | $9,311 |
| 2011 | $592 +2.4% | $9,311 +20.5% |
| 2010 | $578 -2% | $7,729 |
| 2009 | $590 +2.5% | $7,729 -5.7% |
| 2008 | $575 -0.6% | $8,193 |
| 2007 | $579 +0% | $8,193 |
| 2006 | $579 +3.6% | $8,193 |
| 2005 | $559 +0.1% | $8,193 +5% |
| 2004 | $559 +13.7% | $7,802 |
| 2003 | $491 +0% | $7,802 +15% |
| 2002 | $491 +0.1% | $6,784 |
| 2001 | $491 | $6,784 |
Find assessor info on the county website
Monthly payment
Est. payment
Payment breakdown
Explore the cost of this home by adjusting the details. Changes won't be saved.Climate risks
Neighborhood: Fairmount
Nearby schools
Schools provided by the listing agent
- Elementary: Abraham Mallinson
- High: Van Horn
Source: Heartland MLS as distributed by MLS GRID. This data may not be complete. We recommend contacting the local school district to confirm school assignments for this home.

Similar homes
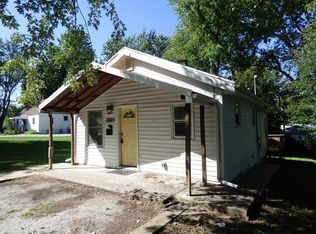
- $49,9003 bd1 ba878 sqft8704 E Roberts Ave, Kansas City, MO 64125For Sale
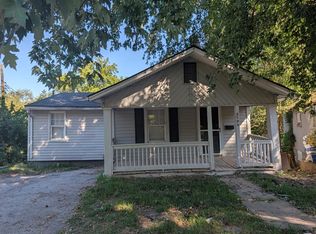 MLS ID #2641092, Ryan Attebery, Orenda Real Estate Services. Heartland MLS as distributed by MLS GRID
- $50,0002 bd1 ba1k sqft436 Tullis Ave, Kansas City, MO 64125For Sale
 MLS ID #2629123, Jourdan Gundersen, RE/MAX Realty Suburban Inc. Heartland MLS as distributed by MLS GRID
- $50,0003 bd1 ba1.1k sqft2023 Brighton Ave, Kansas City, MO 64127For Sale
 MLS ID #2640807, Tarik Wilkes, EXP Realty LLC. Heartland MLS as distributed by MLS GRID
- $44,0002 bd1 ba600 sqft5933 Brooklyn Ave, Kansas City, MO 64130For Sale
 MLS ID #2602436, Jazmine Jackson, Keller Williams Realty Partners Inc.. Heartland MLS as distributed by MLS GRID
- $57,5003 bd2 ba1.5k sqft3237 Wabash Ave, Kansas City, MO 64128Auction
 MLS ID #26061367, Cheryl Rabin, REALHome Services & Solutions, Inc. MARIS
