NAI Ohio Equities is pleased to offer 3349 and 3357-3361 E Broad Street, a 10-unit garden-style multifamily portfolio located in the heart of Columbus' Eastmoor neighborhood. Encompassing ±9,416 square feet on ±0.65 acres, the building includes six 1-bed/1-bath and four 2-bed/1-bath units. Resident parking includes 12 rear surface spaces located at 3349 E Broad Street and a detached 6-car garage located at 3357-3367 E Broad Street. Zoned Mixed-Use (UGN-1) and currently in receivership, the property represents a compelling value-add opportunity for investors seeking to unlock income potential through renovation and strategic lease-up.
This stretch of Broad Street falls within Columbus's new Zone In rezoning initiative, designed to support increased residential density and mixed-use development along key transit corridors. Zoned Mixed-Use (UGN-1), the site offers long-term redevelopment potential in a rapidly evolving area. Currently in receivership, this property presents a strong value-add opportunity for investors focused on repositioning and lease-up potential.
For sale
$730,000
3349 E Broad St, Columbus, OH 43213
--beds
0baths
--sqft
Condominium
Built in 1940
-- sqft lot
$-- Zestimate®
$--/sqft
$-- HOA
What's special
- 49 days
- 129
- 10
Zillow last checked:
Listing updated:
Listed by:
Andrew Francis Green 614-701-8751,
NAI Ohio Equities, Realtors,
Peter C Merkle 614-629-5240,
NAI Ohio Equities, Realtors
Source: Columbus and Central Ohio Regional MLS ,MLS#: 226037177
Facts & features
Interior
Bedrooms & bathrooms
- Bathrooms: 0
Property
Parking
- Total spaces: 6
Lot
- Size: 0.65 Acres
Details
- Additional parcels included: 010093087
- Parcel number: 010093088
- Zoning description: Mixed-Use, UGN-
- Special conditions: Third Party Approval,Standard
Construction
Type & style
- Home type: MultiFamily
- Property subtype: Condominium
Condition
- Year built: 1940
Community & HOA
Location
- Region: Columbus
Financial & listing details
- Tax assessed value: $246,300
- Annual tax amount: $6,464
- Date on market: 9/30/2026
Estimated market value
Not available
Estimated sales range
Not available
Not available
Price history
| Date | Event | Price |
|---|---|---|
| 9/30/2026 | Listed for sale | $730,000+160.7% |
Source:  Columbus and Central Ohio Regional MLS #226037177 Report a problem | ||
| 8/25/2025 | Listing removed | $280,000 |
Source: Columbus and Central Ohio Regional MLS #225026141 Report a problem | ||
| 8/25/2025 | Contingent | $280,000 |
Source: Columbus and Central Ohio Regional MLS #225026141 Report a problem | ||
| 7/15/2025 | Listed for sale | $280,000-78.5% |
Source: Columbus and Central Ohio Regional MLS #225026141 Report a problem | ||
| 6/24/2024 | Listed for sale | $1,300,000+57.6% |
Source: Columbus and Central Ohio Regional MLS #224021217 Report a problem | ||
| 9/14/2022 | Listing removed | -- |
Source: Columbus and Central Ohio Regional MLS #222032670 Report a problem | ||
| 9/8/2022 | Price change | $825,000-9.3% |
Source: Columbus and Central Ohio Regional MLS #222032670 Report a problem | ||
| 9/2/2022 | Pending sale | $910,000 |
Source: Columbus and Central Ohio Regional MLS #222032670 Report a problem | ||
| 8/30/2022 | Listed for sale | $910,000+574.6% |
Source: Columbus and Central Ohio Regional MLS #222032670 Report a problem | ||
| 10/25/2021 | Listing removed | -- |
Source: Zillow Rental Manager Report a problem | ||
| 10/21/2021 | Price change | $650-13.3% |
Source: Zillow Rental Manager Report a problem | ||
| 10/18/2021 | Listed for rent | $750+11.1% |
Source: Zillow Rental Manager Report a problem | ||
| 12/31/2019 | Listing removed | $675 |
Source: Zillow Rental Manager Report a problem | ||
| 12/16/2019 | Price change | $675+17.4% |
Source: Zillow Rental Manager Report a problem | ||
| 11/15/2019 | Listed for rent | $575-3.4% |
Source: Zillow Rental Manager Report a problem | ||
| 7/23/2019 | Listing removed | $595 |
Source: Zillow Rental Network Report a problem | ||
| 7/1/2019 | Listed for rent | $595+3.5% |
Source: Zillow Rental Network Report a problem | ||
| 3/12/2019 | Listing removed | $575 |
Source: Zillow Rental Network Report a problem | ||
| 2/8/2019 | Listed for rent | $575-14.8% |
Source: Zillow Rental Network Report a problem | ||
| 9/16/2018 | Listing removed | $675 |
Source: Owner Report a problem | ||
| 7/24/2018 | Price change | $675+17.4% |
Source: Owner Report a problem | ||
| 6/22/2018 | Listed for rent | $575 |
Source: Owner Report a problem | ||
| 2/7/2018 | Sold | $134,900 |
Source: Columbus and Central Ohio Regional MLS #218001143 Report a problem | ||
Public tax history
| Year | Property taxes | Tax assessment |
|---|---|---|
| 2025 | $6,464 +1% | $86,210 |
| 2024 | $6,399 +1.6% | $86,210 |
| 2023 | $6,297 +12% | $86,210 +15% |
| 2022 | $5,622 -0.4% | $74,970 |
| 2021 | $5,646 +0.7% | $74,970 |
| 2020 | $5,608 +9% | $74,970 +20% |
| 2019 | $5,146 +0.3% | $62,480 |
| 2018 | $5,129 | $62,480 |
| 2017 | $5,129 -0.9% | $62,480 +5% |
| 2016 | $5,178 +7.7% | $59,500 |
| 2015 | $4,808 | $59,500 |
| 2014 | $4,808 +101.9% | $59,500 |
| 2013 | $2,381 | $59,500 |
Find assessor info on the county website
Monthly payment
Est. payment
Payment breakdown
Explore the cost of this home by adjusting the details. Changes won't be saved.Climate risks
Neighborhood: Eastmoor


Similar homes
- $370,000-- bd-- ba-- sqft107 N Hampton Rd, Columbus, OH 43213For Sale
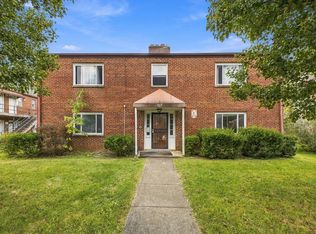
 MLS ID #226040054, Remington Lyman, Reafco. Columbus and Central Ohio Regional MLS
- $370,000-- bd-- ba-- sqft81 N Hampton Rd, Columbus, OH 43213For Sale
 MLS ID #226040047, Remington Lyman, Reafco. Columbus and Central Ohio Regional MLS
- $750,0005 bd2 ba3.2k sqft367 E Jenkins Ave, Columbus, OH 43207For Sale
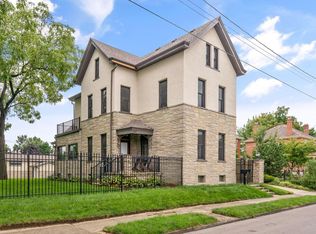 MLS ID #226031086, Shelley A Cottrell, Howard Hanna Real Estate Svcs. Columbus and Central Ohio Regional MLS
- $799,0004 bd4 ba2.2k sqft671 S 3rd St, Columbus, OH 43206For Sale
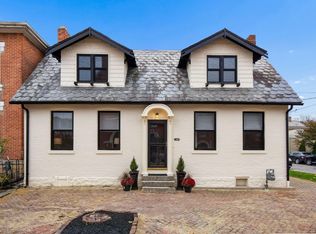 MLS ID #226042979, Mara Ackermann, RE/MAX Consultant Group. Columbus and Central Ohio Regional MLS
- $838,0005 bd5 ba4.7k sqft205 Woodland Ave, Columbus, OH 43203For SaleMLS ID #226040266, John D Mahon, Casto Residential Realty. Columbus and Central Ohio Regional MLS
- $735,000-- bd-- ba-- sqft1244 Summit St #1246, Columbus, OH 43201For SaleMLS ID #226037116, Jill S Fergus, Keller Williams Capital Ptnrs. Columbus and Central Ohio Regional MLS
- $525,000-- bd-- ba-- sqft1134 S Cassingham Rd, Columbus, OH 43209For SaleMLS ID #226042195, Richard Russo, Rich Russo Realty & Co.. Columbus and Central Ohio Regional MLS
- $689,9003 bd3 ba2.1k sqft30 S Dawson Ave, Columbus, OH 43209For SaleMLS ID #226024758, Kyle D Widder, Coldwell Banker Realty. Columbus and Central Ohio Regional MLS
- $375,8985 bd4 ba2.3k sqft320 Briarwood Dr, Columbus, OH 43213For SaleMLS ID #226039625, Gregery T Watson, Red 1 Realty. Columbus and Central Ohio Regional MLS
- $650,000-- bd-- ba-- sqft1084-1086 E Hudson St, Columbus, OH 43211For SaleMLS ID #226032175, Zeke Liston, Forge Real Estate Advisors. Columbus and Central Ohio Regional MLS
- $394,900-- bd-- ba-- sqft587 Eastmoor Blvd, Columbus, OH 43209For SaleMLS ID #226042174, Austin E Steed, Lim Realty Group. Columbus and Central Ohio Regional MLS
- $750,000-- bd-- ba-- sqft1756 Wyandotte Rd, Columbus, OH 43212For SaleMLS ID #226024495, Michael J Lerner, Advocate Real Estate, LLC. Columbus and Central Ohio Regional MLS
- $549,900-- bd-- ba-- sqft1377 Bryden Rd, Columbus, OH 43205For SaleMLS ID #226041135, Jacob V Fisk, Red 1 Realty. Columbus and Central Ohio Regional MLS
- $399,9004 bd4 ba2k sqft658 Linwood Ave, Columbus, OH 43205For SaleMLS ID #226043040, Andrey Karamiants, Keller Williams Greater Cols. Columbus and Central Ohio Regional MLS
- $495,000-- bd-- ba-- sqft1662 E Sycamore St, Columbus, OH 43206For SaleMLS ID #226037760, Amalea Harding, Dream Living LLC. Columbus and Central Ohio Regional MLS
- $599,900-- bd-- ba-- sqft2030 Jane Ave, Columbus, OH 43219For SaleMLS ID #226024928, Oliver Chapman, Keller Williams Consultants. Columbus and Central Ohio Regional MLS
- $519,000-- bd-- ba-- sqft2319 Argyle Dr, Columbus, OH 43219For SaleMLS ID #226024883, John H Crites, Crites Realty Company. Columbus and Central Ohio Regional MLS
- $929,900-- bd-- ba-- sqft87-89 Warren St, Columbus, OH 43215For SaleMLS ID #226037726, Miranda Pierce, Red 1 Realty. Columbus and Central Ohio Regional MLS
- $475,0005 bd5 ba3.5k sqft1819 Franklin Park S, Columbus, OH 43205For SaleMLS ID #226037244, Theresa M Bland, H. C. Bland Realty. Columbus and Central Ohio Regional MLS
