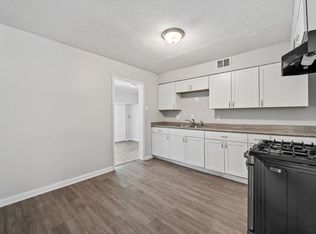
Excellent addition to your portfolio. Tenant occupied and professionally managed. Currently rented for $1094.50/mo with a $995 security deposit on file. Bathroom, kitchen and roof all replaced in recent years. Do not approach or disturb tenant. No showings without an accepted offer. No assignment or seller finance. Multiple properties available. Can be bought individually or in bulk. Addresses include 3227 Southbridge, 1654 Prescott, 3352 Berea and 3686 Southland.
For sale
Price cut: $2K (11/7)
$108,000
3352 Berea Rd, Memphis, TN 38109
3beds
1,344sqft
Single Family Residence
Built in 1954
0.32 Acres Lot
$106,900 Zestimate®
$80/sqft
$-- HOA
What's special
- 17 days
- 124
- 10
Likely to sell faster than
Zillow last checked:
Listing updated:
Listed by:
William H Haynes,
Crye-Leike, Inc., REALTORS 901-756-8900,
Tyler Tapley,
Crye-Leike, Inc., REALTORS
Source: MAAR,MLS#: 10233109
Facts & features
Interior
Bedrooms & bathrooms
- Bedrooms: 3
- Bathrooms: 1
- Full bathrooms: 1
Primary bedroom
- Width: 0
Dining room
- Width: 0
Kitchen
- Features: Pantry
Living room
- Width: 0
Den
- Width: 0
Heating
- Central
Cooling
- Central Air
Features
- All Bedrooms Down, Square Feet Source: AutoFill (MAARdata) or Public Records (Cnty Assessor Site)
- Flooring: Part Carpet
- Has fireplace: No
Interior area
- Total interior livable area: 1,344 sqft
Property
Parking
- Total spaces: 1
- Parking features: Driveway/Pad
- Covered spaces: 1
- Has uncovered spaces: Yes
Features
- Stories: 1
- Exterior features: Other (See REMARKS)
- Pool features: None
Lot
- Size: 0.32 Acres
- Dimensions: 70 x 200
- Features: Level
Details
- Parcel number: 075073 00023
Construction
Type & style
- Home type: SingleFamily
- Architectural style: Traditional
- Property subtype: Single Family Residence
Materials
- Brick Veneer
Condition
- New construction: No
- Year built: 1954
Community & HOA
Community
- Subdivision: Barton Heights 1st Addn
Location
- Region: Memphis
Financial & listing details
- Price per square foot: $80/sqft
- Tax assessed value: $129,700
- Annual tax amount: $1,709
- Price range: $108K - $108K
- Date on market: 10/23/2026
- Cumulative days on market: 18 days
Estimated market value
$106,900
$102,000 - $112,000
$1,133/mo
Price history
| Date | Event | Price |
|---|---|---|
| 11/7/2026 | Price change | $108,000-1.8%$80/sqft |
Source:  MAAR #10233109 Report a problem | ||
| 10/23/2026 | Listed for sale | $110,000+2.8%$82/sqft |
Source: MAAR #10233109 Report a problem | ||
| 4/14/2022 | Sold | $107,000-1.8%$80/sqft |
Source: MAAR #10119335 Report a problem | ||
| 3/15/2022 | Contingent | $109,000$81/sqft |
Source: MAAR #10119335 Report a problem | ||
| 3/11/2022 | Listed for sale | $109,000+118%$81/sqft |
Source: MAAR #10119335 Report a problem | ||
| 12/10/2021 | Sold | $50,000-12.3%$37/sqft |
Source: MAAR #10111730 Report a problem | ||
| 11/28/2021 | Contingent | $57,000$42/sqft |
Source: MAAR #10111730 Report a problem | ||
| 10/29/2021 | Listed for sale | $57,000-8.1%$42/sqft |
Source: MAAR #10111730 Report a problem | ||
| 10/22/2021 | Listing removed | -- |
Source: MAAR #10100656 Report a problem | ||
| 10/13/2021 | Price change | $62,000-0.6%$46/sqft |
Source: MAAR #10100656 Report a problem | ||
| 9/2/2021 | Price change | $62,400-3.9%$46/sqft |
Source: MAAR #10100656 Report a problem | ||
| 8/17/2021 | Price change | $64,900-3.7%$48/sqft |
Source: MAAR #10100656 Report a problem | ||
| 8/5/2021 | Price change | $67,400-3.6%$50/sqft |
Source: MAAR #10100656 Report a problem | ||
| 7/20/2021 | Price change | $69,900-9.2%$52/sqft |
Source: MAAR #10100656 Report a problem | ||
| 6/1/2021 | Listed for sale | $77,000+180%$57/sqft |
Source: MAAR #10100656 Report a problem | ||
| 12/21/2016 | Sold | $27,500-19.1%$20/sqft |
Source: Public Record Report a problem | ||
| 11/27/2012 | Sold | $34,000+330.4%$25/sqft |
Source: MAAR #3262510 Report a problem | ||
| 8/22/2012 | Listing removed | $7,900$6/sqft |
Source: REAL ESTATE NETWORK Report a problem | ||
| 7/14/2012 | Listed for sale | $7,900-53.5%$6/sqft |
Source: REAL ESTATE NETWORK Report a problem | ||
| 9/30/2011 | Sold | $17,000$13/sqft |
Source: Public Record Report a problem | ||
Public tax history
| Year | Property taxes | Tax assessment |
|---|---|---|
| 2025 | $1,709 +2.2% | $32,425 +27.7% |
| 2024 | $1,673 +8.1% | $25,400 |
| 2023 | $1,547 | $25,400 +272.2% |
| 2022 | -- | $6,825 |
| 2021 | -- | $6,825 -31.4% |
| 2020 | $318 | $9,950 |
| 2019 | $318 -21.1% | $9,950 |
| 2018 | $403 -45.1% | $9,950 |
| 2017 | $734 +118.2% | $9,950 +0.5% |
| 2016 | $337 -17.7% | $9,900 |
| 2014 | $409 | $9,900 |
| 2013 | -- | $9,900 -22.8% |
| 2012 | -- | $12,825 |
| 2011 | -- | $12,825 |
| 2010 | -- | $12,825 |
| 2009 | -- | $12,825 -1% |
| 2008 | -- | $12,950 |
| 2007 | -- | $12,950 |
| 2006 | -- | $12,950 |
| 2005 | -- | $12,950 +27% |
| 2004 | -- | $10,200 |
| 2003 | -- | $10,200 |
| 2002 | -- | $10,200 |
| 2001 | -- | $10,200 -6.2% |
| 2000 | -- | $10,875 |
Find assessor info on the county website
Monthly payment
Est. payment
Payment breakdown
Explore the cost of this home by adjusting the details. Changes won't be saved.Climate risks
Neighborhood: Coro Lake
Similar homes
- $104,9003 bd1 ba1.3k sqft3947 McCain Rd, Memphis, TN 38109For Sale
 MLS ID #10233966, Dean Harris, CrestCore Realty MphsBrokerage. MAAR
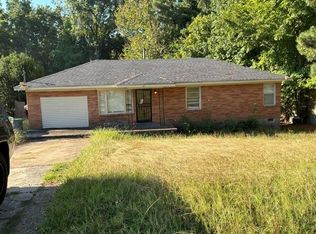
- $99,0003 bd1 ba1.2k sqft21 W Dunbar Rd, Memphis, TN 38109For Sale
 MLS ID #10231935, Bradley Puckett, Reedy & Company, REALTORS. MAAR
- $--3 bd1 ba1k sqft4109 Westmont Rd, Memphis, TN 38109Auction
 Auction.com 2
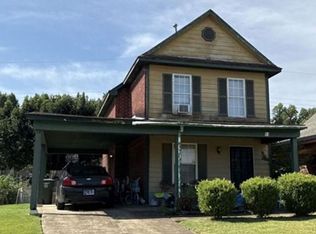
- $--3 bd2 ba1.2k sqft51 Builders Way, Memphis, TN 38109Auction
 Xome
