$105,000
2 bd|1 ba|949 sqft
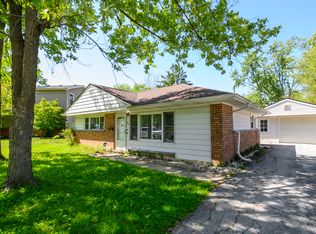
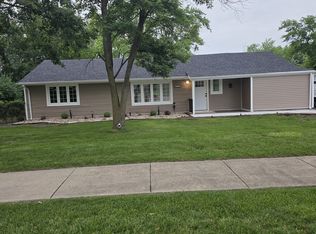
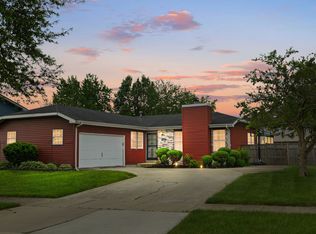
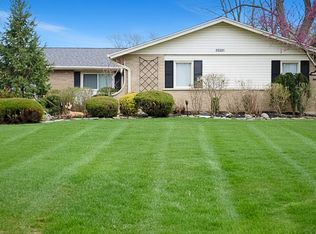
340 Miami St, Park Forest, IL 60466
Off Market
Zillow last checked:
Listing updated:
Milton Payton 708-351-6675,
RE/MAX 10,
Marilyn Payton 708-351-6674,
RE/MAX 10
Not available
Estimated sales range
Not available
Not available
| Date | Event | Price |
|---|---|---|
| 6/23/2026 | Price change | $290,000-7.1%$130/sqft |
Source: | ||
| 6/16/2026 | Listed for sale | $312,000+680%$140/sqft |
Source: | ||
| 5/30/2014 | Sold | $40,000+0.3%$18/sqft |
Source: | ||
| 3/7/2014 | Price change | $39,900-11.1%$18/sqft |
Source: Coldwell Banker Residential Brokerage - Flossmoor #08503871 Report a problem | ||
| 1/4/2014 | Price change | $44,900-10%$20/sqft |
Source: Coldwell Banker Residential Brokerage - Flossmoor #08503871 Report a problem | ||
| 12/17/2013 | Listed for sale | $49,900-48.8%$22/sqft |
Source: Coldwell Banker Residential Brokerage - Flossmoor #08503871 Report a problem | ||
| 5/14/2010 | Listing removed | $97,500$44/sqft |
Source: Keller Williams Preferred Realty #07499466 Report a problem | ||
| 4/15/2010 | Listed for sale | $97,500$44/sqft |
Source: Keller Williams Preferred Realty #07499466 Report a problem | ||
| Year | Property taxes | Tax assessment |
|---|---|---|
| 2024 | -- | $13,000 +0% |
| 2023 | $9,516 +195.1% | $12,999 +123.4% |
| 2022 | $3,224 -1.8% | $5,818 |
| 2021 | $3,283 +0.5% | $5,818 |
| 2020 | $3,267 +13.8% | $5,818 -4.1% |
| 2019 | $2,872 -54.9% | $6,068 |
| 2018 | $6,365 +126.7% | $6,068 |
| 2017 | $2,807 -43.8% | $6,068 +20.7% |
| 2016 | $4,997 -8.6% | $5,026 -10.6% |
| 2015 | $5,465 +35.4% | $5,625 -17.9% |
| 2014 | $4,037 +29% | $6,849 +8.1% |
| 2013 | $3,130 +0.9% | $6,334 |
| 2012 | $3,101 -18.4% | $6,334 -11.5% |
| 2011 | $3,802 -8.1% | $7,156 -28.5% |
| 2010 | $4,136 +12.4% | $10,007 |
| 2009 | $3,680 +8.3% | $10,007 -5% |
| 2008 | $3,399 +3.9% | $10,534 +7.5% |
| 2007 | $3,272 +3.2% | $9,800 |
| 2006 | $3,170 +7.9% | $9,800 |
| 2005 | $2,939 -3.9% | $9,800 +23.5% |
| 2004 | $3,059 +14.5% | $7,933 |
| 2003 | $2,671 +4.8% | $7,933 |
| 2002 | $2,550 +6.3% | $7,933 +3.1% |
| 2001 | $2,398 +4.2% | $7,696 |
| 2000 | $2,301 -21.1% | $7,696 |
| 1999 | $2,916 | $7,696 |
Find assessor info on the county website
Source: MRED as distributed by MLS GRID. This data may not be complete. We recommend contacting the local school district to confirm school assignments for this home.
A local agent can set up tours, give advice and negotiate with sellers.
A local lender can help you make sure your offer is ready when you are.