$15,590
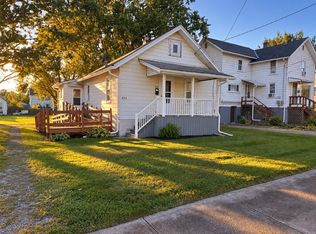
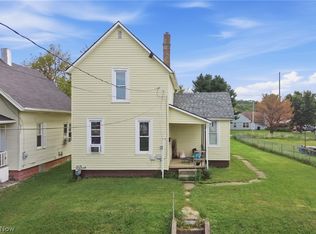
3 bd1 ba1k sqft
333 7th Ave, Mansfield, OH 44905
Off Market

Zillow last checked:
Listing updated:
Brian Running 4195288260,
Dream Huge Realty

Not available
Estimated sales range
Not available
$971/mo
| Date | Event | Price |
|---|---|---|
| 10/8/2026 | Price change | $99,000-10%$123/sqft |
Source:  MAR #20100793 Report a problem | ||
| 9/11/2026 | Listed for sale | $110,000+223.5%$136/sqft |
Source: MAR #20100793 Report a problem | ||
| 6/24/2023 | Listing removed | -- |
Source: Zillow Rentals Report a problem | ||
| 6/17/2023 | Listed for rent | $850$1/sqft |
Source: Zillow Rentals Report a problem | ||
| 4/27/2021 | Sold | $34,000-2.9%$42/sqft |
Source: MAR #9048646 Report a problem | ||
| 3/5/2021 | Listed for sale | $35,000$43/sqft |
Source: Dream Huge Realty #9048646 Report a problem | ||
| 11/3/2020 | Listing removed | $35,000$43/sqft |
Source: Dream Huge Realty #9048646 Report a problem | ||
| 10/28/2020 | Listed for sale | $35,000+169.2%$43/sqft |
Source: Dream Huge Realty #9048646 Report a problem | ||
| 5/28/2019 | Sold | $13,000+116.7%$16/sqft |
Source: Public Record Report a problem | ||
| 8/14/2007 | Sold | $6,000-66.7%$7/sqft |
Source: Public Record Report a problem | ||
| 10/3/2006 | Sold | $18,000-37.9%$22/sqft |
Source: Public Record Report a problem | ||
| 9/7/1999 | Sold | $29,000-36.2%$36/sqft |
Source: Public Record Report a problem | ||
| 4/13/1999 | Sold | $45,420+101.9%$56/sqft |
Source: Public Record Report a problem | ||
| 1/7/1998 | Sold | $22,500+48%$28/sqft |
Source: Public Record Report a problem | ||
| 9/15/1997 | Sold | $15,200+406.7%$19/sqft |
Source: Public Record Report a problem | ||
| 7/26/1996 | Sold | $3,000$4/sqft |
Source: Public Record Report a problem | ||
| Year | Property taxes | Tax assessment |
|---|---|---|
| 2025 | $410 0% | $9,930 |
| 2024 | $410 +0.2% | $9,930 |
| 2023 | $409 +122.5% | $9,930 +142.2% |
| 2022 | $184 +0% | $4,100 |
| 2021 | $184 -1% | $4,100 |
| 2020 | $186 +6.7% | $4,100 +18.2% |
| 2019 | $174 +0.9% | $3,470 |
| 2018 | $173 -32.7% | $3,470 -34% |
| 2017 | $256 +109.6% | $5,260 +114.7% |
| 2016 | $122 +2% | $2,450 |
| 2015 | $120 +0.4% | $2,450 |
| 2014 | $120 +107.2% | $2,450 -2.8% |
| 2012 | $58 | $2,520 |
| 2011 | -- | $2,520 -1.2% |
| 2010 | $99 +0.8% | $2,550 |
| 2009 | $98 +0.5% | $2,550 |
| 2008 | $97 -68.4% | $2,550 -69.2% |
| 2006 | $308 | $8,285 |
Source: MAR. This data may not be complete. We recommend contacting the local school district to confirm school assignments for this home.
A local agent can set up tours, give advice and negotiate with sellers.
A local lender can help you make sure your offer is ready when you are.