$311,100
3 bd|2 ba|983 sqft
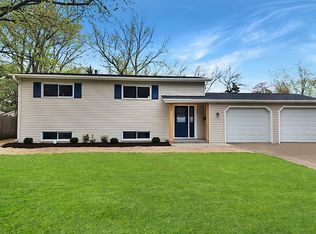
11 Codorus Rd, Montgomery, IL 60538
Off Market
Zillow last checked:
Marie Simandl 630-435-3500,
Platinum Partners Realtors
Not available
Estimated sales range
Not available
Not available
| Date | Event | Price |
|---|---|---|
| 2/14/2025 | Sold | $227,500-10.7%$207/sqft |
Source: | ||
| 1/13/2025 | Contingent | $254,900$232/sqft |
Source: | ||
| 1/9/2025 | Price change | $254,900-1.9%$232/sqft |
Source: | ||
| 11/30/2024 | Price change | $259,900-1.9%$236/sqft |
Source: | ||
| 11/7/2024 | Listed for sale | $265,000+18.6%$241/sqft |
Source: | ||
| 8/11/2022 | Listing removed | -- |
Source: | ||
| 5/27/2022 | Price change | $223,400-0.7%$203/sqft |
Source: | ||
| 5/20/2022 | Listed for sale | $224,900+36.3%$204/sqft |
Source: | ||
| 12/3/2018 | Sold | $165,000-2.9%$150/sqft |
Source: Public Record Report a problem | ||
| 10/8/2018 | Pending sale | $169,900$154/sqft |
Source: CENTURY 21 Affiliated #09932951 Report a problem | ||
| 8/28/2018 | Price change | $169,900-2.9%$154/sqft |
Source: CENTURY 21 Affiliated #09932951 Report a problem | ||
| 7/19/2018 | Price change | $174,900-2.8%$159/sqft |
Source: CENTURY 21 Affiliated #09932951 Report a problem | ||
| 7/4/2018 | Price change | $179,900-2.8%$164/sqft |
Source: CENTURY 21 Affiliated #09932951 Report a problem | ||
| 5/1/2018 | Listed for sale | $185,000+51%$168/sqft |
Source: CENTURY 21 Affiliated #09932951 Report a problem | ||
| 4/19/2001 | Sold | $122,500$111/sqft |
Source: Public Record Report a problem | ||
| Year | Property taxes | Tax assessment |
|---|---|---|
| 2024 | $6,426 +1% | $81,186 +10% |
| 2023 | $6,361 +5.8% | $73,805 +9% |
| 2022 | $6,015 +3.2% | $67,711 +7% |
| 2021 | $5,826 +3% | $63,281 +4% |
| 2020 | $5,658 +12.8% | $60,847 +8.9% |
| 2019 | $5,017 | $55,865 +9.6% |
| 2018 | $5,017 +5.8% | $50,976 +8.5% |
| 2017 | $4,744 +7.4% | $46,982 +9% |
| 2016 | $4,417 +2.9% | $43,103 +8% |
| 2015 | $4,292 | $39,911 +4% |
| 2014 | $4,292 | $38,376 -5% |
| 2013 | -- | $40,396 -7.6% |
| 2012 | -- | $43,711 -9% |
| 2011 | -- | $48,034 -10% |
| 2010 | -- | $53,371 -2% |
| 2009 | -- | $54,473 +7.3% |
| 2008 | -- | $50,785 +3% |
| 2007 | -- | $49,306 |
| 2006 | $3,273 | $49,306 +6.7% |
| 2005 | -- | $46,210 +6.5% |
| 2004 | -- | $43,390 +4.5% |
| 2003 | $2,632 | $41,502 +8.5% |
| 2002 | $2,632 +6% | $38,251 +2.9% |
| 2001 | $2,483 +3.3% | $37,173 +5.5% |
| 2000 | $2,405 | $35,235 |
Find assessor info on the county website
Source: MRED as distributed by MLS GRID. This data may not be complete. We recommend contacting the local school district to confirm school assignments for this home.
A local agent can set up tours, give advice and negotiate with sellers.