EXCEPTIONAL DEVELOPMENT OPPORTUNITY IN BERWYN! An exciting opportunity for developers, builders, and investors to bring their vision to life. Explore proposed development concepts featuring three 12-unit buildings totaling 36 residences, or an alternative configuration of seven 3-unit buildings. Architectural blueprints and conceptual renderings are available to showcase the property's potential. Ideally located near the Metra Station, shopping, dining, parks, and schools, with convenient access to downtown Chicago and surrounding suburbs via I-55. THE LAND IS HERE. THE VISION IS YOURS. THE POSSIBILITIES ARE ENDLESS! Proposed developments are subject to rezoning and municipal approvals. Buyer to verify zoning and development feasibility.
Active
$799,000
3401 Ridgeland Ave, Berwyn, IL 60402
--beds
--baths
--sqft
Unimproved Land
Built in ----
-- sqft lot
$-- Zestimate®
$--/sqft
$-- HOA
What's special
The land is here
- --
- 43
- views
- 2
- saves
Zillow last checked:
Listing updated:
Listed by:
Heidi Lapczynska 773-308-3886,
Better Homes & Gardens Real Estate Connections
Source: MRED as distributed by MLS GRID,MLS#: 12797530
Facts & features
Property
Features
- Frontage length: 206
Details
- Parcel number: 16321300090000
- Zoning: SINGL
- Special conditions: None
Utilities & green energy
- Water: Municipal Water
- Utilities for property: Electric to Site, Natural Gas Available
Community & HOA
Location
- Region: Berwyn
Financial & listing details
- Tax assessed value: $39,610
- Annual tax amount: $1,415
- Date on market: 10/30/2026
- Ownership: Fee Simple
- Electric utility on property: Yes
- Road surface type: None
Estimated market value
Not available
Estimated sales range
Not available
Not available
Price history
| Date | Event | Price |
|---|---|---|
| 10/21/2026 | Listing removed | $860,000 |
Source:  MRED as distributed by MLS GRID #12676208 Report a problem | ||
| 6/12/2026 | Listed for sale | $860,000-4.3% |
Source: MRED as distributed by MLS GRID #12676208 Report a problem | ||
| 4/23/2026 | Listing removed | $899,000 |
Source: MRED as distributed by MLS GRID #12447354 Report a problem | ||
| 8/15/2025 | Listed for sale | $899,000+1% |
Source: MRED as distributed by MLS GRID #12447354 Report a problem | ||
| 6/1/2025 | Listing removed | $890,000 |
Source: MRED as distributed by MLS GRID #12273073 Report a problem | ||
| 1/17/2025 | Listed for sale | $890,000-22.6% |
Source: MRED as distributed by MLS GRID #12273073 Report a problem | ||
| 12/4/2024 | Listing removed | $1,150,000+29.2% |
Source: MRED as distributed by MLS GRID #12136345 Report a problem | ||
| 8/19/2024 | Listed for sale | $890,000-19.1% |
Source: MRED as distributed by MLS GRID #12136345 Report a problem | ||
| 7/29/2024 | Listing removed | -- |
Source: MRED as distributed by MLS GRID #12033351 Report a problem | ||
| 4/22/2024 | Listed for sale | $1,100,000-2.6% |
Source: MRED as distributed by MLS GRID #12033351 Report a problem | ||
| 8/23/2023 | Listing removed | -- |
Source: MRED as distributed by MLS GRID #11701117 Report a problem | ||
| 1/14/2023 | Listed for sale | $1,129,000-9.7% |
Source: MRED as distributed by MLS GRID #11701117 Report a problem | ||
| 12/13/2021 | Listing removed | -- |
Source: MRED as distributed by MLS GRID #11033875 Report a problem | ||
| 3/26/2021 | Listed for sale | $1,250,000 |
Source: MRED as distributed by MLS GRID #11033875 Report a problem | ||
Public tax history
| Year | Property taxes | Tax assessment |
|---|---|---|
| 2024 | $1,472 +4% | $3,961 +0.1% |
| 2023 | $1,415 -40% | $3,959 -23.7% |
| 2022 | $2,358 +3.1% | $5,189 |
| 2021 | $2,287 +5.8% | $5,189 |
| 2020 | $2,162 +28.6% | $5,189 +39.2% |
| 2019 | $1,681 +6.2% | $3,729 |
| 2018 | $1,582 -2.3% | $3,729 |
| 2017 | $1,619 +9.1% | $3,729 +9% |
| 2016 | $1,484 +2% | $3,421 |
| 2015 | $1,454 +3.7% | $3,421 |
| 2014 | $1,403 +12.5% | $3,421 |
| 2013 | $1,247 +5.3% | $3,421 |
| 2012 | $1,184 +6.5% | $3,421 |
| 2011 | $1,111 +16.9% | $3,421 +2.1% |
| 2010 | $951 -19.4% | $3,349 -18.7% |
| 2009 | $1,179 -4.7% | $4,121 -20% |
| 2008 | $1,238 -5.5% | $5,153 -3.3% |
| 2007 | $1,310 -3% | $5,330 -8.3% |
| 2006 | $1,351 -7.1% | $5,814 -7.7% |
| 2005 | $1,454 -6.8% | $6,299 +5.6% |
| 2004 | $1,560 -10.5% | $5,967 -13.3% |
| 2003 | $1,743 +16.8% | $6,885 +24.4% |
| 2001 | $1,492 -0.5% | $5,534 |
| 2000 | $1,500 +19% | $5,534 |
| 1999 | $1,261 | $5,534 |
Find assessor info on the county website
Monthly payment
Climate risks
Neighborhood: 60402
Nearby schools
Schools provided by the listing agent
- District: 100
Source: MRED as distributed by MLS GRID. This data may not be complete. We recommend contacting the local school district to confirm school assignments for this home.
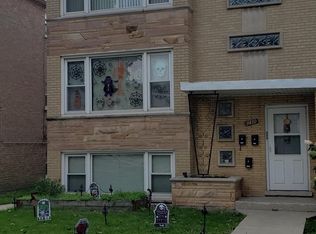
Similar homes
- $749,999149 acres0 Hwy 77, Chicog, WI 60601Active
 MLS ID #1605091, Leslie Boyea. WIREX MLS
- $799,9000.38 acres6040 W Cermak Rd, Cicero, IL 60804Active
 MLS ID #11247457, Richard Simpson, Mid-America Realty & Investment. MRED as distributed by MLS GRID
- $699,0000.56 acres910 Saint Stephens Grn #125, Oak Brook, IL 60523New
 MLS ID #12798456, Lina Shah, Coldwell Banker Realty. MRED as distributed by MLS GRID
- $600,0002.16 acres233 Midway Dr, Willowbrook, IL 60527For Sale By Owner

