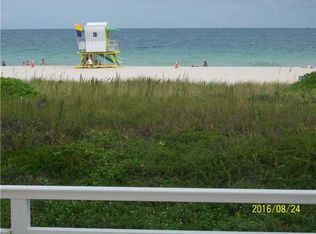
Newly renovated building w/new heated pool & elevators and is completing 50 year remodel including impact windows & doors, new exterior, new lobby, new hallways & more all paid for by the Seller In fantastic location-right on the sand in SoFi the most desirable neighborhood in south beach & near wonderful shops & restaurants. Maintenance fee includes 24 hr security, cable, internet and laundry rooms on each floor. The apartment looks west over Ocean drive on the 3rd floor with a large 24 foot wide balcony. Proof of funds required to weed out scammers! Contact for more info. Please no cold call Agents looking for listing..
For sale by owner
$411,000
345 Ocean Dr APT 304, Miami Beach, FL 33139
1beds
662sqft
Condo
Built in 1970
-- sqft lot
$366,800 Zestimate®
$621/sqft
$950/mo HOA
What's special
New heated poolNew exteriorNew hallwaysImpact windows and doorsNew lobby
What the owner loves about this home
The back exit from the pool to the sand. The new gym and all the great restaurants in SoFi.
- 23 hours
- 188
- 4
Listed by:
Property Owner (305) 775-8780
Facts & features
Interior
Bedrooms & bathrooms
- Bedrooms: 1
- Bathrooms: 1
- Full bathrooms: 1
Heating
- Heat pump
Cooling
- Central
Appliances
- Included: Refrigerator
Features
- Flooring: Laminate
Interior area
- Total interior livable area: 662 sqft
Property
Parking
- Parking features: On-street
Features
- Exterior features: Cement / Concrete
- On waterfront: Yes
Details
- Parcel number: 0242031180180
Construction
Type & style
- Home type: Condo
Materials
- Roof: Asphalt
Condition
- New construction: No
- Year built: 1970
Community & HOA
HOA
- Has HOA: Yes
- HOA fee: $950 monthly
Location
- Region: Miami Beach
Financial & listing details
- Price per square foot: $621/sqft
- Tax assessed value: $359,053
- Annual tax amount: $6,736
- Date on market: 11/11/2026
Estimated market value
$366,800
$348,000 - $385,000
$3,374/mo
Price history
| Date | Event | Price |
|---|---|---|
| 11/11/2026 | Listed for sale | $411,000+4.6%$621/sqft |
Source: Owner Report a problem | ||
| 7/21/2026 | Listing removed | $392,900$594/sqft |
Source:  MIAMI #A12008048 Report a problem | ||
| 4/27/2026 | Listed for sale | $392,900-0.8%$594/sqft |
Source: MIAMI #A12008048 Report a problem | ||
| 4/16/2026 | Listing removed | $396,000$598/sqft |
Source: MIAMI #A11726845 Report a problem | ||
| 5/9/2025 | Price change | $396,000-0.8%$598/sqft |
Source: MIAMI #A11726845 Report a problem | ||
| 1/17/2025 | Price change | $399,000-10.7%$603/sqft |
Source: MIAMI #A11726845 Report a problem | ||
| 12/22/2024 | Price change | $447,000-1.5%$675/sqft |
Source: Owner Report a problem | ||
| 9/3/2024 | Listed for sale | $454,000+16.7%$686/sqft |
Source: Owner Report a problem | ||
| 10/1/2023 | Listing removed | -- |
Source: MIAMI #A11261305 Report a problem | ||
| 5/22/2023 | Listing removed | $389,000$588/sqft |
Source: MIAMI #A11261305 Report a problem | ||
| 2/18/2023 | Price change | $389,000+3.7%$588/sqft |
Source: MIAMI #A11261305 Report a problem | ||
| 8/24/2022 | Listed for sale | $375,000+13.3%$566/sqft |
Source: MIAMI #A11261305 Report a problem | ||
| 3/4/2022 | Listing removed | -- |
Source: Owner Report a problem | ||
| 2/9/2022 | Price change | $331,000+1.5%$500/sqft |
Source: Owner Report a problem | ||
| 12/27/2021 | Price change | $326,000+2.5%$492/sqft |
Source: Owner Report a problem | ||
| 12/14/2021 | Listed for sale | $318,000$480/sqft |
Source: Owner Report a problem | ||
| 9/27/2021 | Listing removed | -- |
Source: Owner Report a problem | ||
| 6/22/2021 | Price change | $318,000+1.3%$480/sqft |
Source: Owner Report a problem | ||
| 5/28/2021 | Price change | $314,000+1%$474/sqft |
Source: Owner Report a problem | ||
| 5/18/2021 | Listed for sale | $311,000$470/sqft |
Source: Owner Report a problem | ||
| 1/18/2021 | Listing removed | -- |
Source: Owner Report a problem | ||
| 12/27/2020 | Price change | $311,0000%$470/sqft |
Source: Owner Report a problem | ||
| 11/13/2020 | Price change | $311,111+0%$470/sqft |
Source: Owner Report a problem | ||
| 6/3/2020 | Listed for sale | $311,000+357.4%$470/sqft |
Source: Owner Report a problem | ||
| 1/12/1993 | Sold | $68,000$103/sqft |
Source: Agent Provided Report a problem | ||
Public tax history
| Year | Property taxes | Tax assessment |
|---|---|---|
| 2025 | $6,736 +9.8% | $359,053 +10% |
| 2024 | $6,134 +2% | $326,412 +4.1% |
| 2023 | $6,012 +12.2% | $313,583 +10% |
| 2022 | $5,356 -0.1% | $285,076 +4.2% |
| 2021 | $5,361 +8.1% | $273,460 +10% |
| 2020 | $4,958 +13.2% | $248,600 +10% |
| 2019 | $4,380 -1.4% | $226,000 -1.4% |
| 2018 | $4,444 | $229,229 +10% |
| 2017 | $4,444 +12% | $208,390 |
| 2016 | $3,968 -3.9% | $208,390 |
| 2015 | $4,129 +4.3% | $208,390 +7% |
| 2014 | $3,957 +7.2% | $194,760 |
| 2013 | $3,691 | $194,760 +8% |
| 2012 | $3,691 -1.1% | $180,330 |
| 2011 | $3,733 -6.2% | $180,330 |
| 2010 | $3,979 +7.3% | $180,330 |
| 2009 | $3,710 +152.4% | $180,330 +147.5% |
| 2007 | $1,470 -10.6% | $72,856 |
| 2006 | $1,644 | -- |
| 2005 | $1,644 +2.2% | -- |
| 2004 | $1,608 +4.7% | -- |
| 2003 | $1,536 +4.2% | -- |
| 2002 | $1,473 | -- |
| 2001 | $1,473 | -- |
Find assessor info on the county website
Monthly payment
Est. payment
Payment breakdown
Explore the cost of this home by adjusting the details. Changes won't be saved.Climate risks
Neighborhood: South Pointe
- $399,1001 bd1 ba656 sqft345 Ocean Dr APT 207, Miami Beach, FL 33139Off Market

- $400,2001 bd1 ba659 sqft345 Ocean Dr APT 208, Miami Beach, FL 33139Off Market

- $408,2001 bd1 ba659 sqft345 Ocean Dr APT 209, Miami Beach, FL 33139Off Market

- $440,0001 bd1 ba662 sqft345 Ocean Dr APT 210, Miami Beach, FL 33139Off Market
Similar homes
- $345,0001 bd1 ba837 sqftMirador 1200, Miami Beach, FL 33139For Sale
 MLS ID #A12120058, Olla Hussein, Elite Ocean View Realty LLC. MIAMI
- $389,9001 bd1 ba650 sqftSholom House, Miami Beach, FL 33139For Sale
 MLS ID #A12032872, Liza Gomez, Luxe Properties. MIAMI
- $385,0001 bd2 ba723 sqftMirador 1035, Miami Beach, FL 33139For Sale
 MLS ID #A12115388, Juan Carlos Gonzalez PA, Compass Florida, LLC. MIAMI
- $449,0001 bd1 ba655 sqftThe Presidential Condo, Miami Beach, FL 33139For Sale
 MLS ID #A12064858, Benito Guido, Beachfront Realty Inc. MIAMI
- $349,0001 bd1 ba720 sqftCollins Tower Condos, Miami Beach, FL 33139For SaleMLS ID #A12110973, Bryan Halda, Compass Florida, LLC. MIAMI
- $475,0001 bd1 ba659 sqftThe Presidential Condo, Miami Beach, FL 33139For SaleMLS ID #A12056754, Richard Corrales, Silverleaf Realty Group. MIAMI
- $475,0001 bd1 ba654 sqftOcean Point, Miami Beach, FL 33139For SaleMLS ID #A12016035, Danell Van Orden, The Keyes Company. MIAMI
- $415,0001 bd1 ba852 sqftMirador 1000 Condo, Miami Beach, FL 33139For SaleMLS ID #A12006930, Ekaterina Lavrova PA, South Florida Investments. MIAMI
- $420,0002 bd2 ba940 sqftOctagon Towers, Miami Beach, FL 33139For Sale
 MLS ID #B26038462, Ann Chamberlain, Keller Williams Realty Profess. BeachesMLS
- $350,0001 bd1 ba730 sqftWest Ave Condo, Miami Beach, FL 33139For SaleMLS ID #A12109062, Corrado Colini, Douglas Elliman. MIAMI
- $449,0002 bd2 ba880 sqftBayview Plaza Condo, Miami Beach, FL 33139For SaleMLS ID #A12076429, Hirokazu Sumida, Coldwell Banker Realty. MIAMI
- $355,000-- bd1 ba552 sqftMirador 1200 Condo, Miami Beach, FL 33139For SaleMLS ID #A12062330, Colleen Holloway, Coldwell Banker Realty. MIAMI
- $340,0001 bd1 ba567 sqftIslander Condominium, Miami Beach, FL 33139For SaleMLS ID #A12025910, Juan Zuluaga, Coldwell Banker Realty. MIAMI
- $305,0001 bd2 ba766 sqftAdmiral Towers, Miami Beach, FL 33139For SaleMLS ID #A12038224, Renata Markovska, Better Homes & Gdns RE Fla 1st. MIAMI
- $499,9001 bd1 ba820 sqftThe Decoplage, Miami Beach, FL 33139For SaleMLS ID #A12101603, Richard Corrales, Silverleaf Realty Group. MIAMI
- $380,0002 bd2 ba710 sqftLake Beach Club Condo, Miami Beach, FL 33140For SaleMLS ID #A12102349, Andrea Carazas, Avanti Way Realty LLC. MIAMI
- $299,0001 bd1 ba700 sqftPark Gardens, Miami Beach, FL 33139For SaleMLS ID #A12080730, Danell Van Orden, The Keyes Company. MIAMI
- $415,000-- bd1 ba518 sqftTriton Tower Condo, Miami Beach, FL 33140For SaleMLS ID #A12103516, Joseph Barbosa, Miami New Realty. MIAMI
- $340,000-- bd1 ba746 sqftMirador 1000 Condo, Miami Beach, FL 33139For SaleMLS ID #A11626014, Madeleyne Sutton, One Sotheby's International Realty. MIAMI
- $425,0001 bd2 ba900 sqftClearview Towers Condo, Miami Beach, FL 33140For SaleMLS ID #A12104172, Asnel Medina, The Salazar Group Real Estate, LLC.. MIAMI
