Nestled among the trees in the Shingletown and Lake McCumber area, this 3-bedroom, 2-bath home offers 1,344 square feet of living space on 1.89 acres. Enjoy the privacy and peaceful surroundings of a quiet road, with room to spread out and outbuildings for added versatility. If you're looking for a property with a little breathing room and a wooded setting, this one is worth a look.
Lot next door is also available for sale, great opportunity to get both!
For sale
$170,000
34610 Westward Ho Rd, Shingletown, CA 96088
3beds
1,344sqft
Single Family Residence
Built in 1981
1.89 Acres Lot
$168,100 Zestimate®
$126/sqft
$-- HOA
What's special
Wooded settingQuiet roadOutbuildings for added versatilityPrivacy and peaceful surroundingsRoom to spread out
- 20 days
- 530
- 15
Likely to sell faster than
Zillow last checked:
Listing updated:
Listed by:
John Wildey DRE #01857877 530-276-4576,
Coldwell Banker Select Real Estate - Redding
Source: SMLS,MLS#: 26-6540
Facts & features
Interior
Bedrooms & bathrooms
- Bedrooms: 3
- Bathrooms: 2
- Full bathrooms: 2
Heating
- Has Heating (Unspecified Type)
Cooling
- Other
Features
- Flooring: Laminate, Wall to Wall Carpet
- Has basement: No
- Has fireplace: Yes
- Fireplace features: Wood Stove, Living Room
Interior area
- Total structure area: 1,344
- Total interior livable area: 1,344 sqft
Property
Parking
- Parking features: Off Street
Features
- Levels: One
- Pool features: None
- Has view: Yes
Lot
- Size: 1.89 Acres
- Features: Level
Details
- Parcel number: 700110016000
Construction
Type & style
- Home type: SingleFamily
- Architectural style: Ranch
- Property subtype: Single Family Residence
Materials
- T1-11
- Foundation: Slab
- Roof: Metal
Condition
- Year built: 1981
Utilities & green energy
- Water: Well
Community & HOA
HOA
- Has HOA: No
Location
- Region: Shingletown
Financial & listing details
- Price per square foot: $126/sqft
- Tax assessed value: $175,827
- Date on market: 11/11/2026
- Listing terms: All Cash to Seller,Cash,Submit
- Road surface type: Gravel, Dirt
Estimated market value
$168,100
$160,000 - $177,000
$1,922/mo
Price history
| Date | Event | Price |
|---|---|---|
| 11/11/2026 | Listed for sale | $170,000$126/sqft |
Source:  SMLS #26-6540 Report a problem | ||
| 11/3/2026 | Pending sale | $170,000$126/sqft |
Source: SMLS #26-6540 Report a problem | ||
| 10/23/2026 | Listed for sale | $170,000-14.8%$126/sqft |
Source: SMLS #26-6540 Report a problem | ||
| 8/31/2026 | Listing removed | $199,500$148/sqft |
Source: eXp Realty #26-3104 Report a problem | ||
| 8/24/2026 | Price change | $199,500-4.5%$148/sqft |
Source: SMLS #26-3104 Report a problem | ||
| 8/18/2026 | Price change | $209,000-4.6%$156/sqft |
Source: SMLS #26-3104 Report a problem | ||
| 8/6/2026 | Price change | $219,000-2.7%$163/sqft |
Source: SMLS #26-3104 Report a problem | ||
| 7/28/2026 | Price change | $225,000-4.3%$167/sqft |
Source: SMLS #26-3104 Report a problem | ||
| 7/13/2026 | Price change | $235,000-5.6%$175/sqft |
Source: SMLS #26-3104 Report a problem | ||
| 6/27/2026 | Listed for sale | $249,000+47.3%$185/sqft |
Source: SMLS #26-3104 Report a problem | ||
| 3/15/2024 | Sold | $169,000-0.5%$126/sqft |
Source: Public Record Report a problem | ||
| 2/29/2024 | Pending sale | $169,900$126/sqft |
Source: SMLS #24-653 Report a problem | ||
| 2/14/2024 | Listed for sale | $169,900-2.9%$126/sqft |
Source: SMLS #24-653 Report a problem | ||
| 1/16/2024 | Listing removed | $174,900$130/sqft |
Source: SMLS #23-2544 Report a problem | ||
| 11/22/2023 | Listed for sale | $174,900$130/sqft |
Source: SMLS #23-2544 Report a problem | ||
| 10/16/2023 | Listing removed | -- |
Source: SMLS #23-2544 Report a problem | ||
| 10/13/2023 | Listed for sale | $174,900$130/sqft |
Source: SMLS #23-2544 Report a problem | ||
| 9/20/2023 | Listing removed | -- |
Source: SMLS #23-2544 Report a problem | ||
| 9/5/2023 | Price change | $174,900-7.9%$130/sqft |
Source: SMLS #23-2544 Report a problem | ||
| 8/14/2023 | Price change | $189,900-4.8%$141/sqft |
Source: SMLS #23-2544 Report a problem | ||
| 8/7/2023 | Price change | $199,500-0.2%$148/sqft |
Source: SMLS #23-2544 Report a problem | ||
| 6/24/2023 | Listed for sale | $199,900+24.9%$149/sqft |
Source: SMLS #23-2544 Report a problem | ||
| 10/12/2017 | Sold | $160,000-5.9%$119/sqft |
Source: SMLS #17-4169 Report a problem | ||
| 8/9/2017 | Listed for sale | $169,999+80.8%$126/sqft |
Source: CENTURY 21 Hilltop #17-4169 Report a problem | ||
| 7/23/1999 | Sold | $94,000$70/sqft |
Source: Public Record Report a problem | ||
Public tax history
| Year | Property taxes | Tax assessment |
|---|---|---|
| 2026 | -- | $175,827 -3.4% |
| 2025 | $1,980 +5.5% | $182,047 +2% |
| 2024 | $1,877 +1.8% | $178,478 +2% |
| 2023 | $1,844 +2.5% | $174,980 +2% |
| 2022 | $1,799 +3.3% | $171,550 +2% |
| 2021 | $1,742 -1.6% | $168,188 +1% |
| 2020 | $1,771 +3% | $166,464 +2% |
| 2019 | $1,719 +1.2% | $163,200 +2% |
| 2018 | $1,699 +27.3% | $160,000 +28.5% |
| 2017 | $1,334 +6% | $124,470 +2% |
| 2016 | $1,259 +4.4% | $122,030 +1.5% |
| 2015 | $1,206 | $120,198 |
Find assessor info on the county website
Monthly payment
Est. payment
Payment breakdown
Explore the cost of this home by adjusting the details. Changes won't be saved.Climate risks
Neighborhood: 96088
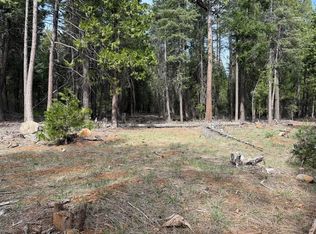


Similar homes
- $185,0002 bd1 ba1k sqft35482 Shenandoah Dr, Shingletown, CA 96088For Sale
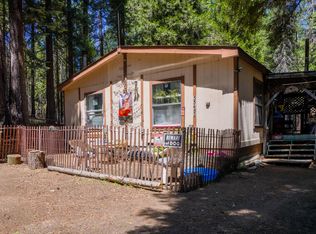 MLS ID #26-3236, Richard A Howe. SMLS
- $139,9003 bd2 ba1.4k sqft30806 Thumper Dr, Shingletown, CA 96088For Sale
 MLS ID #26-6045, Mike A Neves. SMLS
- $239,9003 bd2 ba1.4k sqft7556 Red Eagle Rd, Shingletown, CA 96088For Sale
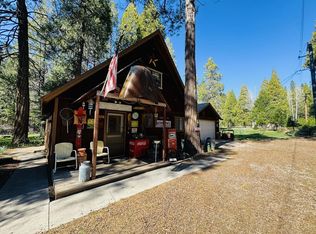 MLS ID #26-1218, Suzan Sheffer. SMLS
- $209,9002 bd1 ba1k sqft7660 Eastwood Way, Shingletown, CA 96088For Sale
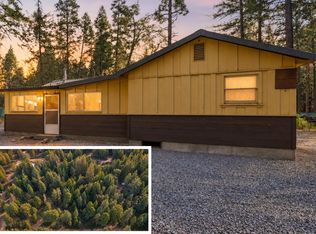 MLS ID #26-5672, Dan Metz. SMLS
