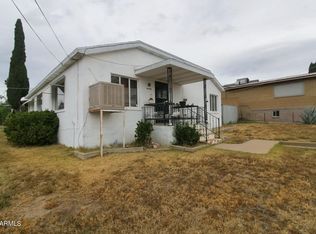
$148,200
2 bd|1 ba|711 sqft
367 W Pinal St, Globe, AZ 85501
Off Market

Likely to sell faster than
Zillow last checked:
Listing updated:
Michelle Yerkovich 928-200-1552,
Stallings & Long Realty

Not available
Estimated sales range
Not available
Not available
| Date | Event | Price |
|---|---|---|
| 6/20/2026 | Listed for sale | $245,000+14.5%$225/sqft |
Source: Globe / Miami AOR #1806751 Report a problem | ||
| 6/1/2026 | Listing removed | $2,200$2/sqft |
Source: Zillow Rentals Report a problem | ||
| 5/26/2026 | Listed for rent | $2,200+10%$2/sqft |
Source: Zillow Rentals Report a problem | ||
| 4/17/2025 | Listing removed | $2,000$2/sqft |
Source: Zillow Rentals Report a problem | ||
| 4/1/2025 | Listed for rent | $2,000$2/sqft |
Source: Zillow Rentals Report a problem | ||
| 3/24/2025 | Listing removed | $2,000$2/sqft |
Source: Zillow Rentals Report a problem | ||
| 3/3/2025 | Listed for rent | $2,000+17.6%$2/sqft |
Source: Zillow Rentals Report a problem | ||
| 10/14/2024 | Listing removed | $1,700$2/sqft |
Source: Zillow Rentals Report a problem | ||
| 4/23/2024 | Listing removed | -- |
Source: Zillow Rentals Report a problem | ||
| 4/16/2024 | Listed for rent | $1,700$2/sqft |
Source: Zillow Rentals Report a problem | ||
| 3/29/2024 | Sold | $214,000-2.7%$196/sqft |
Source: | ||
| 2/16/2024 | Pending sale | $219,900$202/sqft |
Source: | ||
| 2/10/2024 | Listed for sale | $219,900+339.8%$202/sqft |
Source: Globe / Miami AOR #1806316 Report a problem | ||
| 8/16/2023 | Sold | $50,000$46/sqft |
Source: Public Record Report a problem | ||
| 2/11/2020 | Listing removed | $50,000$46/sqft |
Source: Keller Williams Realty Biltmore Partners #6007637 Report a problem | ||
| 11/22/2019 | Listed for sale | $50,000+66.7%$46/sqft |
Source: Keller Williams Realty Biltmore Partners #6007637 Report a problem | ||
| 8/28/2007 | Sold | $30,000$28/sqft |
Source: Public Record Report a problem | ||
| Year | Property taxes | Tax assessment |
|---|---|---|
| 2026 | $691 +5.4% | $13,983 +34.8% |
| 2025 | $655 +2% | $10,370 +20.2% |
| 2024 | $643 +2% | $8,628 |
| 2023 | $630 -5.2% | -- |
| 2022 | $665 +6.9% | -- |
| 2021 | $622 +5.1% | -- |
| 2019 | $592 +2.9% | -- |
| 2018 | $575 +12% | -- |
| 2017 | $513 | -- |
| 2016 | $513 +3.9% | -- |
| 2015 | $494 | -- |
| 2014 | -- | -- |
| 2013 | -- | $4,218 -4.7% |
| 2012 | -- | $4,424 -17.7% |
| 2011 | -- | $5,376 -17% |
| 2010 | -- | $6,478 |
| 2009 | -- | -- |
| 2008 | $274 | -- |
| 2007 | -- | -- |
| 2006 | $288 | -- |
| 2005 | -- | -- |
| 2004 | -- | -- |
| 2003 | -- | -- |
| 2002 | -- | -- |
Find assessor info on the county website
Source: ARMLS. This data may not be complete. We recommend contacting the local school district to confirm school assignments for this home.
A local agent can set up tours, give advice and negotiate with sellers.