Beautiful new construction..
Active
$275,000
363 Butler Ave S, Lehigh Acres, FL 33974
3beds
1,060sqft
Single Family Residence
Built in 2026
10,471 Square Feet Lot
$274,000 Zestimate®
$259/sqft
$-- HOA
What's special
- 6 days
- 125
- 8
Likely to sell faster than
Zillow last checked:
Listing updated:
Listed by:
Diana Arencibia 239-895-1025,
Tropical D&D Realty LLC,
Denisley Tabares 239-850-1036,
Tropical D&D Realty LLC
Source: Florida Gulf Coast MLS,MLS#: 2026043034 Originating MLS: Florida Gulf Coast
Facts & features
Interior
Bedrooms & bathrooms
- Bedrooms: 3
- Bathrooms: 2
- Full bathrooms: 2
Rooms
- Room types: None
Heating
- Central, Electric
Cooling
- Central Air, Electric
Appliances
- Included: Water Softener
Features
- Separate/Formal Dining Room, Other, See Remarks, Split Bedrooms, None
- Flooring: Tile
- Windows: Double Hung, Impact Glass
Interior area
- Total structure area: 1,355
- Total interior livable area: 1,060 sqft
Property
Parking
- Total spaces: 1
- Parking features: Attached, Garage
- Attached garage spaces: 1
Features
- Exterior features: Security/High Impact Doors, None
- Has view: Yes
- View description: City
- Waterfront features: None
Lot
- Size: 10,471 Square Feet
- Dimensions: 80 x 120 x 80 x 120
- Features: Rectangular Lot
Details
- Parcel number: 114527L405022.0210
- Lease amount: $0
- Zoning description: RS-1
Construction
Type & style
- Home type: SingleFamily
- Architectural style: Traditional
- Property subtype: Single Family Residence
Materials
- Block, Concrete, Stucco
- Roof: Shingle
Condition
- New Construction
- New construction: Yes
- Year built: 2026
Utilities & green energy
- Sewer: Septic Tank
- Utilities for property: Cable Not Available
Community & HOA
Community
- Features: Non-Gated
- Condo and coop fee: $0
- Membership fee: $0
- Subdivision: LEHIGH ACRES
HOA
- Has HOA: No
- Amenities included: None
- Services included: None
Location
- Region: Lehigh Acres
Financial & listing details
- Price per square foot: $259/sqft
- Tax assessed value: $15,343
- Annual tax amount: $443
- Date on market: 10/14/2026
- Listing terms: All Financing Considered,Cash
- Ownership: Single Family
Estimated market value
$274,000
$260,000 - $288,000
Not available
Price history
| Date | Event | Price |
|---|---|---|
| 10/14/2026 | Listed for sale | $275,000+1281.9%$259/sqft |
Source:  Florida Gulf Coast MLS #2026043034 Report a problem | ||
| 8/6/2024 | Pending sale | $19,900$19/sqft |
Source:  SWFLMLS #224064077 Report a problem | ||
| 8/2/2024 | Listed for sale | $19,900-35.8%$19/sqft |
Source: SWFLMLS #224064077 Report a problem | ||
| 7/26/2024 | Sold | $31,000-3.1%$29/sqft |
Source:  BeachesMLS #R11001848 Report a problem | ||
| 7/24/2024 | Pending sale | $32,000$30/sqft |
Source: BeachesMLS #RX-11001848 Report a problem | ||
| 7/5/2024 | Listed for sale | $32,000$30/sqft |
Source: BeachesMLS #RX-11001848 Report a problem | ||
Public tax history
| Year | Property taxes | Tax assessment |
|---|---|---|
| 2025 | $444 +33.1% | $15,343 +282.3% |
| 2024 | $333 -21% | $4,013 -45% |
| 2023 | $422 +15.9% | $7,295 +10% |
| 2022 | $364 +12% | $6,632 +10% |
| 2021 | $325 +2.2% | $6,029 +10% |
| 2020 | $318 +85.8% | $5,481 -25.9% |
| 2019 | $171 | $7,400 |
| 2018 | $171 +7.7% | $7,400 +79.7% |
| 2017 | $159 +19.2% | $4,118 -48.5% |
| 2016 | $133 -14.9% | $8,000 +37.9% |
| 2015 | $157 +12.5% | $5,800 +12.2% |
| 2014 | $139 +12.3% | $5,170 +52.1% |
| 2013 | $124 -18.1% | $3,400 -43.3% |
| 2012 | $151 -1.1% | $6,000 |
| 2011 | $153 -1.2% | $6,000 |
| 2010 | $155 -15.8% | $6,000 -25% |
| 2009 | $184 -45.3% | $8,000 -57% |
| 2008 | $336 -44.3% | $18,600 -47.2% |
| 2007 | $604 -56.2% | $35,200 -57.1% |
| 2006 | $1,379 +835.3% | $82,000 +1313.8% |
| 2004 | $147 +69.8% | $5,800 +123.1% |
| 2003 | $87 -1.7% | $2,600 |
| 2002 | $88 | $2,600 +30% |
| 2000 | -- | $2,000 |
Find assessor info on the county website
Monthly payment
Est. payment
Payment breakdown
Explore the cost of this home by adjusting the details. Changes won't be saved.Climate risks
Neighborhood: 33974

Similar homes
- $275,0003 bd2 ba1k sqft365 Butler Ave S, Lehigh Acres, FL 33974New Construction
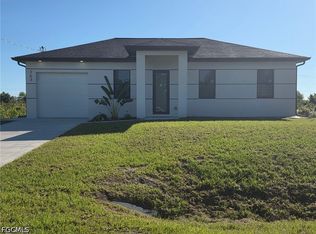
 MLS ID #2026043035, Diana Arencibia, Tropical D&D Realty LLC. Florida Gulf Coast MLS
- $259,0003 bd2 ba1k sqft382 McArthur Blvd, Lehigh Acres, FL 33974New Construction
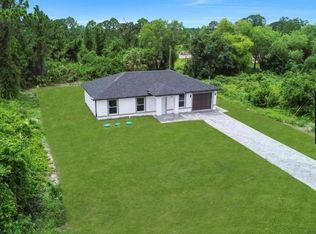 MLS ID #2026043033, Carmen Ramos, Mamba Realty LLC. Florida Gulf Coast MLS
- $274,9003 bd2 ba1.3k sqft313 Shadow Lakes Dr, Lehigh Acres, FL 33974For Sale
 MLS ID #2026043673, Sonia Rios, Sonia Rios Realty. Florida Gulf Coast MLS
- $275,0003 bd2 ba1.1k sqft322 Mangonia Ave, Lehigh Acres, FL 33974New Construction
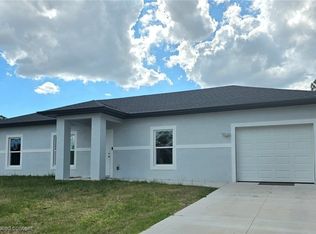 MLS ID #2026042543, Stella Patrice, Real Broker, LLC. Florida Gulf Coast MLS
- $259,0003 bd2 ba1k sqftLehigh Acres, Lehigh Acres, FL 33974New Construction
 MLS ID #A12107328, Maria Auxiliadora Ruiz Marrero, Keller Williams Realty International Lifestyles. MIAMI
- $285,0003 bd2 ba1.5k sqft360 Eisenhower BLVD, LEHIGH ACRES, FL 33974For Sale
 MLS ID #226012310, Janett Cabrera, Key & Legacy Realty LLC. SWFLMLS
- $270,0003 bd2 ba1.1k sqft173 Blakely Ave S, Lehigh Acres, FL 33974New ConstructionMLS ID #2026041134, David Reeve, Hometown Realty of SW Florida. Florida Gulf Coast MLS
- $299,0003 bd3 ba1.4k sqftTwin Lake Estates, Lehigh Acres, FL 33974New ConstructionMLS ID #A12109778, Raul Leyva, Sellstate 5 Star Realty. MIAMI
- $270,0003 bd3 ba1.4k sqft940 Lakeside Dr, Lehigh Acres, FL 33974New ConstructionMLS ID #2026038788, Rosalen Rodriguez, Integrity Florida Realty LLC. Florida Gulf Coast MLS
- $275,0003 bd2 ba1.2k sqft746 Chestnut ST E, LEHIGH ACRES, FL 33974For SaleMLS ID #226030054, Erin Gaudio, Realty One Group MVP. SWFLMLS
- $289,0004 bd2 ba1.5k sqft551 Eisenhower BLVD, LEHIGH ACRES, FL 33974For SaleMLS ID #226027669, Mily Lopez Rodriguez, Mato Realty, LLC. SWFLMLS
- $272,5003 bd2 ba1.2k sqft1222 Summa Blvd, Lehigh Acres, FL 33974For SaleMLS ID #2026021182, William Figueroa, Sovereign Real Estate Group. Florida Gulf Coast MLS
- $269,9003 bd2 ba1.3k sqft1220 Cloplon St E, Lehigh Acres, FL 33974For SaleMLS ID #2026030353, Kristen Roberts, Bentley Hollow Realty LLC. Florida Gulf Coast MLS
- $275,0003 bd2 ba1k sqft454 Norwood Ave S, Lehigh Acres, FL 33974New ConstructionMLS ID #2026012456, Diana Arencibia, Tropical D&D Realty LLC. Florida Gulf Coast MLS
- $249,9003 bd2 ba1k sqft851 Calumet St E, Lehigh Acres, FL 33974New ConstructionMLS ID #2026032445, Leidy Melian, EXP Realty LLC. Florida Gulf Coast MLS
- $285,0004 bd2 ba1.5k sqft431 Gray Ave S, Lehigh Acres, FL 33974For SaleMLS ID #2025023053, Raul Pino, Sovereign Real Estate Group. Florida Gulf Coast MLS
- $305,0003 bd2 ba1.3k sqft318 Genoa Ave S, Lehigh Acres, FL 33974New ConstructionMLS ID #2026042627, Diana Arencibia, Tropical D&D Realty LLC. Florida Gulf Coast MLS
- $255,0003 bd2 ba1.4k sqft1023 Maddock St E, Lehigh Acres, FL 33974For SaleMLS ID #2026041537, Christian Haag, Douglas Realty & Development. Florida Gulf Coast MLS
- $304,9003 bd2 ba1.3k sqft692 Morningmist Ln, Lehigh Acres, FL 33974For SaleMLS ID #2026041519, Donna Martin, Always Island Time Realty LLC. Florida Gulf Coast MLS
- $270,0003 bd2 ba1.3k sqft225 Shadow Lakes Dr, Lehigh Acres, FL 33974For SaleMLS ID #2026030097, Steven Cosenza, Realty Group of SW Florida Inc. Florida Gulf Coast MLS
