This 1008 square foot single family home has 3 bedrooms and 1.0 bathrooms. This home is located at 3680 Jackson Blvd, Fort Lauderdale, FL 33312.
Pre-foreclosure
Est. $395,900
3680 Jackson Blvd, Fort Lauderdale, FL 33312
3beds
1baths
1,008sqft
SingleFamily
Built in 1955
7,348 Square Feet Lot
$395,900 Zestimate®
$393/sqft
$-- HOA
Overview
- 55 days
- 15
- 0
Facts & features
Interior
Bedrooms & bathrooms
- Bedrooms: 3
- Bathrooms: 1
Heating
- central
Cooling
- Central
Appliances
- Included: Refrigerator
Features
- Flooring: Tile
Interior area
- Total interior livable area: 1,008 sqft
Property
Parking
- Total spaces: 1
- Parking features: Carport
Features
- Exterior features: Stucco
Lot
- Size: 7,348 Square Feet
Details
- Parcel number: 504207052900
Construction
Type & style
- Home type: SingleFamily
Materials
- masonry
- Foundation: Other
- Roof: Shake / Shingle
Condition
- Year built: 1955
Community & HOA
Location
- Region: Fort Lauderdale
Financial & listing details
- Price per square foot: $393/sqft
- Tax assessed value: $279,820
- Annual tax amount: $5,452
Foreclosure details
Estimated market value
$395,900
$376,000 - $416,000
$1,746/mo
Price history
| Date | Event | Price |
|---|---|---|
| 7/14/2026 | Listing removed | $399,900$397/sqft |
Source:  BeachesMLS #B26015311 Report a problem | ||
| 6/1/2026 | Pending sale | $399,900$397/sqft |
Source: BeachesMLS #B26015311 Report a problem | ||
| 5/1/2026 | Price change | $399,900-4.8%$397/sqft |
Source: BeachesMLS #B26015311 Report a problem | ||
| 4/14/2026 | Listed for sale | $420,000+5%$417/sqft |
Source: BeachesMLS #B26015311 Report a problem | ||
| 5/16/2025 | Listing removed | $2,500$2/sqft |
Source: BeachesMLS #F10502386 Report a problem | ||
| 5/9/2025 | Listed for rent | $2,500$2/sqft |
Source: BeachesMLS #F10502386 Report a problem | ||
| 5/6/2025 | Listed for sale | $400,000+90.5%$397/sqft |
Source: BeachesMLS #F10501996 Report a problem | ||
| 4/23/2025 | Listing removed | $2,500$2/sqft |
Source:  MIAMI #A11700861 Report a problem | ||
| 12/1/2024 | Listed for rent | $2,500-7.4%$2/sqft |
Source: MIAMI #A11700861 Report a problem | ||
| 11/7/2024 | Listing removed | $2,700$3/sqft |
Source: BeachesMLS #F10460812 Report a problem | ||
| 11/1/2024 | Price change | $2,700-3.6%$3/sqft |
Source: BeachesMLS #F10460812 Report a problem | ||
| 9/21/2024 | Price change | $2,800-6.7%$3/sqft |
Source: BeachesMLS #F10460812 Report a problem | ||
| 9/11/2024 | Listed for rent | $3,000+11.1%$3/sqft |
Source: BeachesMLS #F10460812 Report a problem | ||
| 5/11/2023 | Listing removed | -- |
Source: MIAMI #A11361038 Report a problem | ||
| 3/22/2023 | Listed for rent | $2,700+92.9%$3/sqft |
Source: MIAMI #A11361038 Report a problem | ||
| 9/7/2018 | Sold | $210,000-2.3%$208/sqft |
Source: Public Record Report a problem | ||
| 3/1/2018 | Pending sale | $215,000$213/sqft |
Source: Aventura Office #A10361102 Report a problem | ||
| 10/24/2017 | Listed for sale | $215,000+4.9%$213/sqft |
Source: Aventura Office #A10361102 Report a problem | ||
| 6/19/2017 | Listing removed | $205,000$203/sqft |
Source: Capital Commercial R.E. Group #A10186317 Report a problem | ||
| 6/9/2017 | Listed for sale | $205,000$203/sqft |
Source: Capital Commercial R.E. Group #A10186317 Report a problem | ||
| 5/9/2017 | Pending sale | $205,000$203/sqft |
Source: Capital Commercial R.E. Group #A10186317 Report a problem | ||
| 2/10/2017 | Price change | $205,000-4.6%$203/sqft |
Source: Capital Commercial R.E. Group #A10186317 Report a problem | ||
| 11/30/2016 | Listed for sale | $214,900+114.3%$213/sqft |
Source: Capital Commercial R.E. Group #A10186317 Report a problem | ||
| 6/5/2015 | Listing removed | $1,400$1/sqft |
Source: iHOUSEweb, Inc. #F1337914 Report a problem | ||
| 5/31/2015 | Listed for rent | $1,400$1/sqft |
Source: iHOUSEweb, Inc. #F1337914 Report a problem | ||
| 4/1/2003 | Sold | $100,300$100/sqft |
Source: Public Record Report a problem | ||
Public tax history
| Year | Property taxes | Tax assessment |
|---|---|---|
| 2025 | $5,452 +9.5% | $239,000 +10% |
| 2024 | $4,979 +7.4% | $217,280 +10% |
| 2023 | $4,634 +13.4% | $197,530 +10% |
| 2022 | $4,087 +9.4% | $179,580 +10% |
| 2021 | $3,737 +13% | $163,260 +10% |
| 2020 | $3,308 -11.7% | $148,420 -19.7% |
| 2019 | $3,745 | $184,800 +51.4% |
| 2018 | $3,745 +63.3% | $122,100 +25.6% |
| 2017 | $2,294 +8.7% | $97,180 +10% |
| 2016 | $2,110 +8.3% | $88,350 +10% |
| 2015 | $1,948 +15.7% | $80,320 +10% |
| 2014 | $1,684 | $73,020 -35.7% |
| 2013 | $1,684 -18.4% | $113,510 +18.7% |
| 2012 | $2,063 -8.3% | $95,650 -9.1% |
| 2011 | $2,249 +2.6% | $105,260 +5% |
| 2010 | $2,191 -31.1% | $100,200 -34.6% |
| 2009 | $3,180 -30.8% | $153,320 -32.2% |
| 2008 | $4,598 -5.7% | $226,300 -6.2% |
| 2007 | $4,875 -2.3% | $241,160 +8.4% |
| 2006 | $4,987 | $222,500 +35.1% |
| 2005 | -- | $164,750 +11.3% |
| 2004 | $3,750 +177.1% | $147,990 +90.2% |
| 2003 | $1,353 +2.5% | $77,800 +2.4% |
| 2002 | $1,320 -24.9% | $75,980 +1.6% |
| 2001 | $1,757 +5.5% | $74,790 |
| 2000 | $1,666 | -- |
Find assessor info on the county website
Monthly payment
Climate risks
Neighborhood: Melrose Park
- $--3 bd1 ba-- sqft3680 Jackson Blvd #3680, Fort Lauderdale, FL 33312Off Market
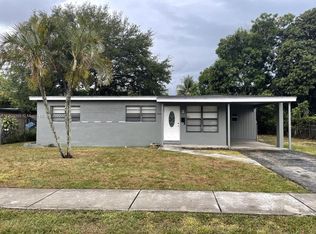
- $377,9003 bd1 ba1.3k sqft3664 Jackson Blvd, Fort Lauderdale, FL 33312Off Market
- $357,5003 bd1 ba1k sqft3700 Jackson Blvd, Fort Lauderdale, FL 33312Off Market

- $400,0003 bd2 ba945 sqft3648 Jackson Blvd, Fort Lauderdale, FL 33312Sold
Similar homes
- $406,0003 bd1 ba1k sqft3531 NW 37th Street, Lauderdale Lakes, FL 33309For Sale

 MLS ID #B26092577, Melissa A Carbonell, Real Broker LLC. BeachesMLS
- $409,9003 bd1 ba1.2k sqft1718 NW 7TH Street, Fort Lauderdale, FL 33311For Sale
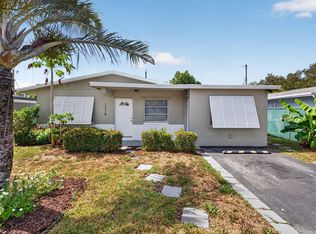 MLS ID #B26070254, Bird John Calixte, Home Free Today Realty. BeachesMLS
- $379,9902 bd1 ba900 sqft880 NW 33rd Terrace NW, Lauderhill, FL 33311For Sale
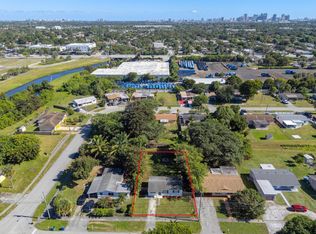 MLS ID #B26091604, Rony Thessier, Coldwell Banker Realty. BeachesMLS
- $515,0004 bd2 ba1.4k sqft670 SW 29th Avenue, Fort Lauderdale, FL 33312For Sale
 MLS ID #B26018329, Maikel Gomez, Real Estate 4 All LLC. BeachesMLS
- $364,9003 bd1 ba925 sqft1708 NW 8th Avenue, Fort Lauderdale, FL 33311For SaleMLS ID #R11166092, Dustin Mercurio, Home Free Today Realty. BeachesMLS
- $500,0003 bd2 ba1.2k sqft4641 SW 25TH Terrace, Dania Beach, FL 33312For SaleMLS ID #B26069642, Charli Miro, Coldwell Banker. BeachesMLS
- $574,9003 bd2 ba1.2k sqft1873 SW 28TH Terrace, Fort Lauderdale, FL 33312For SaleMLS ID #B26071788, Rosemary S Purswell, Douglas Elliman. BeachesMLS
- $549,5004 bd3 ba1.3k sqft5073 SW 28th Avenue, Dania Beach, FL 33312For SaleMLS ID #B26077573, Hanan Bouskila, HBPA Realty. BeachesMLS
- $379,0003 bd3 ba1.3k sqft2280 Anchor Court #2606, Dania Beach, FL 33312For SaleMLS ID #B26020860, Kasey M Forrester, One Sotheby's International Realty. BeachesMLS
- $400,0002 bd1 ba1.2k sqft1716 N 25th Avenue, Hollywood, FL 33020For SaleMLS ID #B26045941, Laura E Sanders, RE/MAX Direct. BeachesMLS
- $499,0003 bd3 ba1.3k sqft1224 NE 5TH Avenue, Fort Lauderdale, FL 33304For SaleMLS ID #B26094072, Mirlande Virgil, Virgil Signature Realty LLC. BeachesMLS
- $550,0003 bd2 ba1.4k sqft721 FAIRWAY Drive, Plantation, FL 33317For SaleMLS ID #B26064919, Marybeth Lee-Pappas, Lamacchia Realty, Inc.. BeachesMLS
- $500,0003 bd2 ba1.2k sqft1220 NE 1ST Avenue, Fort Lauderdale, FL 33304For SaleMLS ID #B26051933, Matthew B Stanley, The Keyes Company. BeachesMLS
- $435,0003 bd2 ba1k sqft261 NE 45th Street, Oakland Park, FL 33334For SaleMLS ID #B26049685, Steve E McAleer, The Agency Florida LLC. BeachesMLS
- $370,0002 bd2 ba1.1k sqft8026 SW 20TH Court, Davie, FL 33324For SaleMLS ID #B26056048, Kristina Marie Seeber, Krissy Llorca Realty LLC. BeachesMLS
- $378,0003 bd1 ba1k sqft5649 SW 36th Court, West Park, FL 33023For SaleMLS ID #F10551169, Loree Nichols, Mainstay Brokerage LLC. BeachesMLS
- $415,0003 bd2 ba1.2k sqft9603 NW 74th Court, Tamarac, FL 33321For SaleMLS ID #B26019240, Mayte Vigoa, One Sotheby's International Realty. BeachesMLS
- $379,0003 bd2 ba1.1k sqft10927 NW 29TH Court, Sunrise, FL 33322For SaleMLS ID #B26063334, Pamela L Segarra, RE/MAX Select Group. BeachesMLS
- $449,0002 bd2 ba1.2k sqft6420 NW 29th Street, Sunrise, FL 33313For SaleMLS ID #B26090327, Arelys R Catena, Century 21 Global Connections. BeachesMLS
- $429,0003 bd2 ba1.2k sqft131 NE 51st Street, Oakland Park, FL 33334For SaleMLS ID #B26006938, Gal Oron, G & E Realty Group, Inc. BeachesMLS
