Income producing legal duplex with excellent investment potential. The property features two attached units with two individual addresses, separate water and electric meters.
Accepting backups
$679,000
371 E 34th St, Hialeah, FL 33013
--beds
--baths
2,040sqft
Duplex
Built in 1973
-- sqft lot
$-- Zestimate®
$333/sqft
$-- HOA
What's special
- 23 days
- 170
- 14
Likely to sell faster than
Zillow last checked:
Listing updated:
Listed by:
Jose Cabrera 954-701-3802,
AmeriFirst Realty
Source: MIAMI,MLS#: A12113799 Originating MLS: A-Miami Association of REALTORS
Facts & features
Interior
Heating
- Central
Cooling
- Central Air
Features
- Flooring: Tile
Interior area
- Total structure area: 2,175
- Total interior livable area: 2,040 sqft
Property
Parking
- Total spaces: 4
Features
- Stories: 1
Lot
- Features: Less Than 1/4 Acre Lot
Details
- Parcel number: 0431060180040
- Zoning: 5400
Construction
Type & style
- Home type: MultiFamily
- Property subtype: Duplex
Materials
- CBS Construction
- Roof: Shingle
Condition
- Year built: 1973
Utilities & green energy
- Sewer: Public Sewer
Community & HOA
Community
- Subdivision: Raceview Park
HOA
- Has HOA: No
Location
- Region: Hialeah
Financial & listing details
- Price per square foot: $333/sqft
- Tax assessed value: $609,507
- Annual tax amount: $9,109
- Date on market: 10/27/2026
- Listing terms: All Cash
Estimated market value
Not available
Estimated sales range
Not available
Not available
Price history
| Date | Event | Price |
|---|---|---|
| 10/29/2026 | Listed for sale | $679,000+147.8%$333/sqft |
Source:  MIAMI #A12113799 Report a problem | ||
| 4/13/2005 | Sold | $274,000$134/sqft |
Source: Public Record Report a problem | ||
Public tax history
| Year | Property taxes | Tax assessment |
|---|---|---|
| 2025 | $9,109 +9.7% | $421,712 +10% |
| 2024 | $8,304 +12.8% | $383,375 +9.4% |
| 2023 | $7,359 +16.2% | $350,507 +10% |
| 2022 | $6,332 +12.6% | $318,643 +10% |
| 2021 | $5,625 +7.5% | $289,676 +10% |
| 2020 | $5,235 +12.9% | $263,342 +10% |
| 2019 | $4,638 +4.8% | $239,402 +2.6% |
| 2018 | $4,425 | $233,385 +10% |
| 2017 | $4,425 +8.8% | $212,169 +8.1% |
| 2016 | $4,068 +14.5% | $196,183 +10% |
| 2015 | $3,552 -0.1% | $178,349 +1.8% |
| 2014 | $3,557 +7.7% | $175,131 +6.6% |
| 2013 | $3,303 | $164,328 +0.8% |
| 2012 | $3,303 -7.1% | $163,093 -5.5% |
| 2011 | $3,556 -20.3% | $172,571 -15.6% |
| 2010 | $4,460 -20.4% | $204,416 -24% |
| 2009 | $5,601 -15.1% | $269,070 -16.7% |
| 2007 | $6,601 +25.5% | $323,051 |
| 2006 | $5,259 | -- |
| 2005 | $5,259 +21.8% | -- |
| 2004 | $4,318 +23.5% | -- |
| 2003 | $3,498 +20.2% | -- |
| 2002 | $2,910 | -- |
| 2001 | $2,910 | -- |
Find assessor info on the county website
Monthly payment
Est. payment
Payment breakdown
Explore the cost of this home by adjusting the details. Changes won't be saved.Climate risks
Neighborhood: 33013
Similar homes
- $725,0004 bd3 ba1.5k sqftCobos Fronton Sub 2, Hialeah, FL 33013For Sale
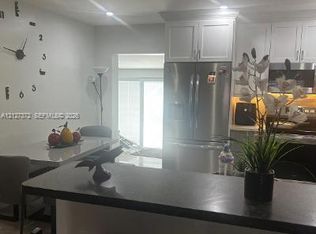
 MLS ID #A12127372, Javier Sotolongo, Legacy Group Real Estate, LLC.. MIAMI
- $635,0003 bd5 ba1.5k sqft572 E 38th St, Hialeah, FL 33013For Sale By Owner
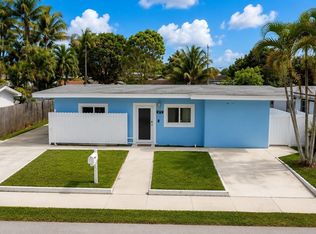
- $700,0005 bd4 ba1.2k sqft6th Addn To Hialeah, Hialeah, FL 33013For Sale
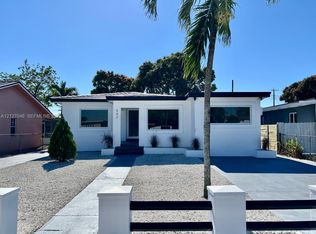 MLS ID #A12127046, Joaquin Garcia, One Stop Realty. MIAMI
- $639,9003 bd2 ba1.3k sqftHialeah 14th Addn, Hialeah, FL 33013For Sale
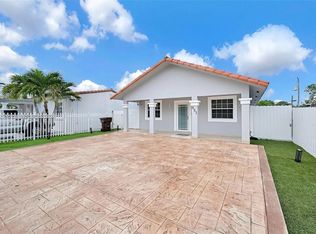 MLS ID #A12124226, Lucia Remond, Tower Team Realty, LLC. MIAMI
- $675,0004 bd2 ba2.1k sqftHialeah 6th Addn, Hialeah, FL 33013For SaleMLS ID #A12109034, Raika Jiha Pujol, Amp Realty Group, LLC. MIAMI
- $680,0005 bd2 ba1.6k sqftIngleside Park, Hialeah, FL 33013For SaleMLS ID #A12115948, Natascha Gonzalez, Circle One Realty, LLC.. MIAMI
- $636,9995 bd3 ba1.7k sqft500 E 40TH STREET, HIALEAH, FL 33013For Sale
 MLS ID #TB8552413, Dayana Machado Díaz, LCA REALTY, LLC. Stellar MLS
- $585,0003 bd2 ba1.9k sqftSunset Manor, Hialeah, FL 33013For SaleMLS ID #A12112627, Denise Grillo, United Realty Group Inc. MIAMI
- $750,0003 bd1 ba2k sqftHialeah 14 Addn, Hialeah, FL 33013For SaleMLS ID #A12110710, Maria Diaz, Brickell Realty Group International. MIAMI
- $629,0006 bd4 ba1.5k sqftCarole Anne Park, Hialeah, FL 33012For SaleMLS ID #A12125767, Jasmin Cabral, Lifestyle International Realty. MIAMI
- $695,0003 bd1 ba1.6k sqft2nd Rev Pl Saratoga Heigh, Hialeah, FL 33013For SaleMLS ID #A12115209, Mayelin Ortega Gonzalez, Universal Realty Group, LLC.. MIAMI
- $599,0004 bd2 ba1.8k sqftHialeah 14 Addn, Hialeah, FL 33013For SaleMLS ID #A12089922, Peter Garcia, Iconic Luxury Real Estate Corp. MIAMI
- $715,0004 bd2 ba1.9k sqftPlat Of Anacris, Hialeah, FL 33012For SaleMLS ID #A12122733, Frances Hernandez, Coldwell Banker Realty. MIAMI
- $699,0004 bd3 ba1.7k sqftLogan Crest, Hialeah, FL 33013For SaleMLS ID #A12079590, Jackeline Ruth Gutierrez Dunaway, Abemar Beltran Real Estate P.A.. MIAMI
- $700,0004 bd2 ba1.5k sqftHialeah 13th Addn Amd Pl, Hialeah, FL 33013New ConstructionMLS ID #A12097092, Yisel Hernandez, Partnership Realty Inc.. MIAMI
- $759,0004 bd3 ba2.2k sqftJai-Alai Heights 1st Addn, Hialeah, FL 33013For SaleMLS ID #A12115860, Daniel Rodriguez, JFA Realty Co. MIAMI
- $749,0004 bd2 ba1.5k sqftHialeah 13th Addn Amd Pl, Hialeah, FL 33013For SaleMLS ID #A12093364, Edelso Riveron, Related Services LLC. MIAMI
- $640,0004 bd2 ba1.5k sqftLinden Gardens, Hialeah, FL 33013For SaleMLS ID #A11837282, Miriam Hernandez, Capstone Realtors Corp. MIAMI
- $630,0004 bd3 ba1.8k sqft6th Addn To Hialeah, Hialeah, FL 33013For SaleMLS ID #A12047647, Lucia Diaz, Keller Williams Realty International Lifestyles. MIAMI
