Opportunity awaits! This property is ready for someone with a vision to bring it back to life. Situated on a spacious lot, the home offers plenty of potential along with a versatile sunroom that could serve as an office, bonus space, or additional living area. A NEW ROOF is already in place, giving you a great head start on renovations. Whether you're looking for your next investment, rental, or personal project, bring your ideas and make this one your own!
For sale
Price cut: $5.5K (10/13)
$59,500
3718 Olive St, Texarkana, TX 75503
2beds
1,310sqft
Single Family Residence
Built in ----
0.35 Acres Lot
$-- Zestimate®
$45/sqft
$-- HOA
What's special
Spacious lotVersatile sunroomNew roof
- 39 days
- 663
- 64
Likely to sell faster than
Zillow last checked:
Listing updated:
Listed by:
Sumer Bright 903-280-2014,
Realty Fanatics Group
Source: TMLS,MLS#: 206029
Facts & features
Interior
Bedrooms & bathrooms
- Bedrooms: 2
- Bathrooms: 1
- Full bathrooms: 1
Rooms
- Room types: Sunroom
Dining room
- Description: Breakfast & Formal
Living room
- Description: Single
Cooling
- Central Air
Appliances
- Included: Dishwasher, Microwave, Oven, Refrigerator
Features
- Ceiling Fan(s)
- Has basement: No
Interior area
- Total structure area: 1,310
- Total interior livable area: 1,310 sqft
Video & virtual tour
Property
Parking
- Parking features: Detached
Features
- Levels: One
- Stories: 1
- Patio & porch: Patio
Lot
- Size: 0.35 Acres
Details
- Parcel number: 44541
Construction
Type & style
- Home type: SingleFamily
- Property subtype: Single Family Residence
Materials
- Foundation: Pillar/Post/Pier
- Roof: Shingle
Condition
- New construction: No
Utilities & green energy
- Sewer: Public Sewer
- Water: Public
Community & HOA
HOA
- Has HOA: No
Location
- Region: Texarkana
Financial & listing details
- Price per square foot: $45/sqft
- Tax assessed value: $62,637
- Date on market: 9/11/2026
Estimated market value
Not available
Estimated sales range
Not available
$1,078/mo
Price history
| Date | Event | Price |
|---|---|---|
| 10/13/2026 | Price change | $59,500-8.5%$45/sqft |
Source: TMLS #206029 Report a problem | ||
| 9/11/2026 | Listed for sale | $65,000-22.6%$50/sqft |
Source: TMLS #206029 Report a problem | ||
| 11/22/2025 | Listing removed | $900$1/sqft |
Source: Zillow Rentals Report a problem | ||
| 11/20/2025 | Price change | $900-10%$1/sqft |
Source: Zillow Rentals Report a problem | ||
| 11/9/2025 | Listed for rent | $1,000$1/sqft |
Source: Zillow Rentals Report a problem | ||
| 6/27/2025 | Listing removed | $1,000$1/sqft |
Source: Zillow Rentals Report a problem | ||
| 6/18/2025 | Listed for rent | $1,000+25%$1/sqft |
Source: Zillow Rentals Report a problem | ||
| 6/2/2025 | Sold | -- |
Source: TMLS #116520 Report a problem | ||
| 5/23/2025 | Contingent | $84,000$64/sqft |
Source: TMLS #116520 Report a problem | ||
| 4/29/2025 | Listed for sale | $84,000$64/sqft |
Source: TMLS #116520 Report a problem | ||
| 4/10/2025 | Contingent | $84,000$64/sqft |
Source: TMLS #116520 Report a problem | ||
| 2/11/2025 | Price change | $84,000-11.1%$64/sqft |
Source: My State MLS #11407589 Report a problem | ||
| 1/13/2025 | Price change | $94,500-10%$72/sqft |
Source: TMLS #116520 Report a problem | ||
| 12/9/2024 | Listed for sale | $105,000+110.4%$80/sqft |
Source: TMLS #116520 Report a problem | ||
| 3/24/2021 | Listing removed | -- |
Source: Owner Report a problem | ||
| 11/14/2013 | Listing removed | $800$1/sqft |
Source: Owner Report a problem | ||
| 11/4/2013 | Sold | -- |
Source: Public Record Report a problem | ||
| 11/1/2013 | Listed for rent | $800$1/sqft |
Source: Owner Report a problem | ||
| 10/9/2013 | Listed for sale | $49,900$38/sqft |
Source: CENTURY 21 All Points Realty #89720 Report a problem | ||
Public tax history
| Year | Property taxes | Tax assessment |
|---|---|---|
| 2025 | -- | $62,637 -4.3% |
| 2024 | $1,549 +6.3% | $65,418 +6.4% |
| 2023 | $1,456 +8.4% | $61,506 +9.3% |
| 2022 | $1,343 +6% | $56,270 +11.2% |
| 2021 | $1,268 +0% | $50,625 +2.1% |
| 2020 | $1,268 +3.1% | $49,571 +3.7% |
| 2019 | $1,229 +9% | $47,808 +11.5% |
| 2018 | $1,128 | $42,869 +1.4% |
| 2017 | $1,128 +2.4% | $42,273 +2.1% |
| 2016 | $1,101 +6.4% | $41,400 +0.7% |
| 2015 | $1,035 | $41,113 +2.7% |
| 2014 | $1,035 | $40,015 |
| 2013 | -- | $40,015 +1.4% |
| 2012 | -- | $39,472 |
| 2011 | -- | $39,472 |
| 2010 | -- | $39,472 +6% |
| 2009 | -- | $37,255 -5.6% |
| 2008 | -- | $39,469 |
Find assessor info on the county website
Monthly payment
Est. payment
Payment breakdown
Explore the cost of this home by adjusting the details. Changes won't be saved.Climate risks
Neighborhood: 75503
Similar homes
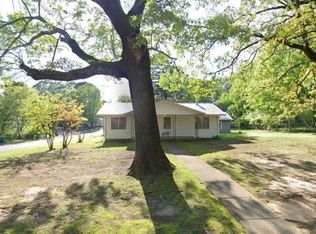
- $54,5002 bd2 ba1.1k sqft321 Orleans St, Texarkana, AR 71854For Sale
 MLS ID #205472, Brian Henry. TMLS
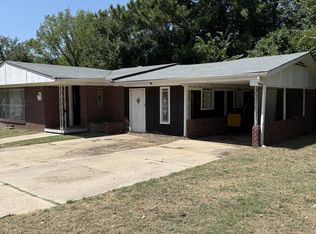
- $69,9003 bd1 ba1.6k sqft2218 W 17th St, Texarkana, TX 75501For Sale
 MLS ID #205934, Travistene Turner. TMLS
- $84,9002 bd1 ba912 sqft1105 E 14th St, Texarkana, AR 71854For Sale
 MLS ID #204540, Sarah Sealy. TMLS
- $49,9893 bd1 ba1.8k sqft2609 Pine St, Texarkana, TX 75503For Sale
 MLS ID #4653822, Chet Polniazek, 1st Texas Realty Services. HAR
