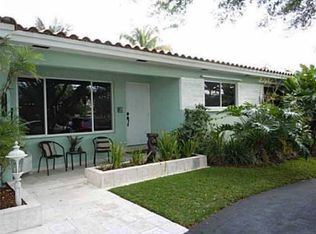
Updated single family pool home in Hollywood Hills near A-rated schools.
This property is off market, which means it's not currently listed for sale or rent on Zillow. This may be different from what's available on other websites or public sources.
$645,900
$601,000 - $691,000
$4,054/mo
$4,054/mo
Rent Zestimate®
Find your next renter with Zillow Rental Manager. Plus, with online applications, you can quickly screen prospective tenants – for free.
$4,054/mo
Rent Zestimate®
$4,494/mo
Est. payment
Refinancing to a lower rate could help reduce your monthly payments and save thousands over the life of the loan.
$4,494/mo
Est. payment
Work with a Zillow partner agent
Leverage their expertise and Zillow's premium Showcase listings to get your home seen by more buyers.
Get startedList with your own agent
Get your home in front of millions of buyers by listing it on Zillow.
Learn how to do itSell it yourself
Take full control of how buyers see your home on Zillow by listing For Sale by Owner (FSBO).
List your homeUpdated single family pool home in Hollywood Hills near A-rated schools.
This property is off market, which means it's not currently listed for sale or rent on Zillow. This may be different from what's available on other websites or public sources.
| Date | Event | Price |
|---|---|---|
| 8/1/2017 | Sold | $335,000-8.2%$174/sqft |
Source: Public Record Report a problem | ||
| 4/3/2017 | Price change | $365,000-3.7%$190/sqft |
Source: Elite Coastal Properties LLC #H10245841 Report a problem | ||
| 3/22/2017 | Listed for sale | $379,000+33%$197/sqft |
Source: Elite Coastal Properties LLC #H10245841 Report a problem | ||
| 12/17/2014 | Listing removed | $2,400$1/sqft |
Source: Listings Rocket Report a problem | ||
| 6/4/2014 | Listed for rent | $2,400+6.7%$1/sqft |
Source: 8932 TAFT ST, PEMBROKE PINES FL 33024 Report a problem | ||
| 1/15/2013 | Sold | $285,000+2.2%$148/sqft |
Source: Public Record Report a problem | ||
| 9/19/2012 | Listed for sale | $279,000-6.8%$145/sqft |
Source: Realty World South Florida Report a problem | ||
| 4/20/2011 | Listing removed | $2,250$1/sqft |
Source: Lenson Realty Inc #F1129756 Report a problem | ||
| 4/17/2011 | Listed for rent | $2,250$1/sqft |
Source: Lenson Realty Inc #F1129756 Report a problem | ||
| 10/8/2010 | Listing removed | $299,500$156/sqft |
Source: London Realty Corp. #F1001291 Report a problem | ||
| 7/16/2009 | Listed for sale | $299,500+8.7%$156/sqft |
Source: London Realty Corp. Report a problem | ||
| 2/26/2008 | Sold | $275,500-37.7%$143/sqft |
Source: Public Record Report a problem | ||
| 11/16/2005 | Sold | $442,500+77%$230/sqft |
Source: Public Record Report a problem | ||
| 11/6/2003 | Sold | $250,000$130/sqft |
Source: Public Record Report a problem | ||
| Year | Property taxes | Tax assessment |
|---|---|---|
| 2025 | $6,042 +1% | $121,560 +2.9% |
| 2024 | $5,985 -41.6% | $118,140 -63.1% |
| 2023 | $10,243 +74.4% | $319,930 +3% |
| 2022 | $5,872 +2.7% | $310,620 +3% |
| 2021 | $5,719 +1.4% | $301,580 +1.4% |
| 2020 | $5,638 +1.2% | $297,420 +2.3% |
| 2019 | $5,571 | $290,740 +1.9% |
| 2018 | $5,571 +4.7% | $285,320 -6.4% |
| 2017 | $5,322 -19.2% | $304,910 +8.4% |
| 2016 | $6,591 +4.6% | $281,240 +10% |
| 2015 | $6,302 +18.1% | $255,680 +10% |
| 2014 | $5,335 | $232,440 +20.1% |
| 2013 | $5,335 +7.5% | $193,540 -9.6% |
| 2012 | $4,964 +3% | $213,980 +4.3% |
| 2011 | $4,819 +1.9% | $205,190 +2% |
| 2010 | $4,730 -10% | $201,170 -15.1% |
| 2009 | $5,256 -0.2% | $236,930 -30% |
| 2008 | $5,265 -28.3% | $338,420 -8.2% |
| 2007 | $7,345 -10.8% | $368,450 -0.9% |
| 2006 | $8,236 | $371,700 +56.4% |
| 2005 | -- | $237,680 +13.5% |
| 2004 | $4,332 +82.6% | $209,410 +82.4% |
| 2003 | $2,372 +2% | $114,800 +2.4% |
| 2002 | $2,327 +2.5% | $112,110 +1.6% |
| 2001 | $2,271 +5.4% | $110,350 |
| 2000 | $2,155 | -- |
Find assessor info on the county website