Triplex located in South Inglewood. Multi-unit property with three units. Conveniently located near schools, shopping, public transportation, and major freeways. Situated in a well-established residential neighborhood with strong rental demand. Great opportunity for an investor or owner-occupant.
For sale
Listed by: Home Saver Realty • Naisa Santeyan • 626-532-0160
Est. $1,600,000
3820 W 107th St, Inglewood, CA 90303
6beds
2,822sqft
Triplex
Built in 1963
-- sqft lot
$1,563,500 Zestimate®
$567/sqft
$-- HOA
Overview
- 159 days
- 97
- 4
Zillow last checked:
Listing updated:
Listed by:
Naisa Santeyan DRE #02028994 626-532-0160,
Home Saver Realty,
Kaitlyn Dares DRE #02161851 657-758-3929,
Home Saver Realty
Source: CRMLS,MLS#: PW26119779 Originating MLS: California Regional MLS
Facts & features
Interior
Bedrooms & bathrooms
- Bedrooms: 6
- Bathrooms: 3
- Full bathrooms: 3
- Main level bathrooms: 3
- Main level bedrooms: 6
Rooms
- Room types: Bedroom
Bedroom
- Features: All Bedrooms Down
Heating
- Central
Cooling
- Central Air
Appliances
- Laundry: None
Features
- All Bedrooms Down
- Has fireplace: No
- Fireplace features: None
- Common walls with other units/homes: 2+ Common Walls
Interior area
- Total interior livable area: 2,822 sqft
Property
Features
- Levels: Multi/Split
- Entry location: 1
- Pool features: None
Lot
- Size: 9,037 Square Feet
- Features: 11-15 Units/Acre
Details
- Parcel number: 4032023002
- Special conditions: Notice Of Default
Construction
Type & style
- Home type: MultiFamily
- Property subtype: Triplex
- Attached to another structure: Yes
Condition
- New construction: No
- Year built: 1963
Utilities & green energy
- Sewer: Public Sewer
- Water: Public
Community & HOA
Community
- Features: Curbs, Sidewalks, Urban
Location
- Region: Inglewood
Financial & listing details
- Price per square foot: $567/sqft
- Tax assessed value: $928,556
- Date on market: 6/2/2026
- Cumulative days on market: 159 days
- Listing terms: Cash,Conventional,FHA
Foreclosure details
Estimated market value
$1,563,500
$1.49M - $1.64M
$4,592/mo
Price history
| Date | Event | Price |
|---|---|---|
| 3/21/2023 | Sold | $875,000-4.8%$310/sqft |
Source: Public Record Report a problem | ||
| 2/14/2023 | Listed for sale | $919,000$326/sqft |
Source:  CRMLS #IN22227304 Report a problem | ||
| 12/31/2022 | Pending sale | $919,000$326/sqft |
Source: CRMLS #IN22227304 Report a problem | ||
| 10/26/2022 | Listed for sale | $919,000$326/sqft |
Source: CRMLS #IN22227304 Report a problem | ||
Public tax history
| Year | Property taxes | Tax assessment |
|---|---|---|
| 2026 | -- | $928,556 +2% |
| 2025 | $12,754 +7% | $910,350 +2% |
| 2024 | $11,915 +357.3% | $892,500 +618% |
| 2023 | $2,605 +11.4% | $124,297 +2% |
| 2022 | $2,338 +1.2% | $121,861 +2% |
| 2021 | $2,310 +3.4% | $119,473 +1% |
| 2020 | $2,234 | $118,249 +2% |
| 2019 | $2,234 +8.1% | $115,931 +2% |
| 2018 | $2,068 | $113,659 +2% |
| 2017 | $2,068 +2.6% | $111,431 +2% |
| 2016 | $2,016 +4.1% | $109,247 +1.5% |
| 2015 | $1,936 +0.5% | $107,607 +2% |
| 2014 | $1,927 | $105,500 +2.5% |
| 2012 | -- | $102,966 +2% |
| 2011 | -- | $100,948 +0.8% |
| 2010 | -- | $100,195 -0.2% |
| 2009 | -- | $100,434 +2% |
| 2008 | -- | $98,465 +2% |
| 2007 | -- | $96,536 +2% |
| 2006 | -- | $94,644 |
| 2005 | -- | $94,644 +4% |
| 2004 | -- | $90,971 +1.9% |
| 2003 | -- | $89,304 +2% |
| 2002 | -- | $87,554 +4% |
| 2000 | -- | $84,156 |
Find assessor info on the county website
Monthly payment
Est. payment
Payment breakdown
Explore the cost of this home by adjusting the details. Changes won't be saved.Climate risks
Neighborhood: 90303
Similar homes
- $999,0008 bd3 ba2.4k sqft4132 W 105th St, Lennox, CA 90304For Sale
 MLS ID #RS26119293, Maria Barragan, Realty ONE Group United. CRMLS
- $974,0003 bd2 ba2k sqft3202 W 111th St, Inglewood, CA 90303For Sale
 MLS ID #26651011, Ronald G Jackson DRE # 01363276, Compass. CLAW
- $1,250,0005 bd3 ba2.2k sqft3520 Farmdale Ave, Los Angeles, CA 90016For Sale
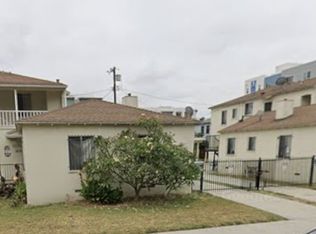 MLS ID #26106425, Yolanda Washington DRE # 01217434, Yolanda Washington. CLAW
- $1,600,0006 bd5 ba4k sqft1433 S Fairfax Ave, Los Angeles, CA 90019For Sale
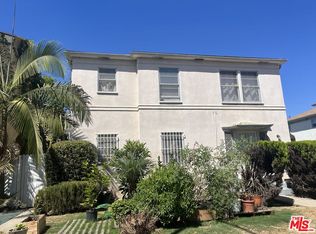 MLS ID #26986111, Wes Wellman DRE # 00467451, Wellman Realty Co.. CLAW
