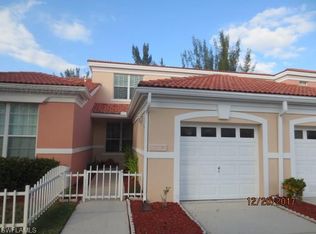
$204,500
2 bd|2 ba|1.2k sqft
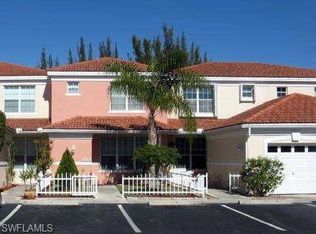
3829 Schoolhouse Rd E APT 7, Fort Myers, FL 33916
Off Market

Likely to sell faster than
Zillow last checked:
Listing updated:
Uriel Vergara 954-695-0366,
Dalton Wade Inc
$263,300
$250,000 - $276,000
$1,953/mo
| Date | Event | Price |
|---|---|---|
| 6/12/2026 | Listed for sale | $275,000$178/sqft |
Source: | ||
| 5/19/2026 | Listing removed | $275,000$178/sqft |
Source: | ||
| 4/19/2026 | Price change | $275,000-1.8%$178/sqft |
Source: | ||
| 2/20/2026 | Listed for sale | $280,000+133.3%$181/sqft |
Source: | ||
| 8/11/2017 | Sold | $120,000-19.9%$78/sqft |
Source: | ||
| 6/27/2017 | Pending sale | $149,900$97/sqft |
Source: BEX Realty, LLC #217034104 Report a problem | ||
| 6/16/2017 | Listed for sale | $149,900$97/sqft |
Source: BEX Realty, LLC #217034104 Report a problem | ||
| 6/4/2017 | Pending sale | $149,900$97/sqft |
Source: BEX Realty, LLC #217034104 Report a problem | ||
| 5/15/2017 | Listed for sale | $149,900+72.3%$97/sqft |
Source: BEX Realty, LLC #217034104 Report a problem | ||
| 11/23/2016 | Listing removed | $1,199+33.2%$1/sqft |
Source: Malt Realty & Dev. Co. #216065551 Report a problem | ||
| 7/10/2012 | Listing removed | $900$1/sqft |
Source: Malt Realty Report a problem | ||
| 6/5/2012 | Listed for rent | $900$1/sqft |
Source: Malt Realty Report a problem | ||
| 11/3/2009 | Sold | $87,000+61.4%$56/sqft |
Source: Public Record Report a problem | ||
| 1/30/2009 | Sold | $53,900-21.8%$35/sqft |
Source: Public Record Report a problem | ||
| 11/2/2008 | Listed for sale | $68,900-53.4%$45/sqft |
Source: Listhub #200858062 Report a problem | ||
| 6/22/2005 | Sold | $147,800+20.1%$95/sqft |
Source: Public Record Report a problem | ||
| 8/11/2003 | Sold | $123,100+25%$80/sqft |
Source: Public Record Report a problem | ||
| 12/31/2002 | Sold | $98,500$64/sqft |
Source: Public Record Report a problem | ||
| Year | Property taxes | Tax assessment |
|---|---|---|
| 2025 | $1,669 +2.1% | $107,863 +2.9% |
| 2024 | $1,635 +3.4% | $104,823 +3% |
| 2023 | $1,581 +0.9% | $101,770 +3% |
| 2022 | $1,568 +1.2% | $98,806 +3% |
| 2021 | $1,550 +7% | $95,928 +1.4% |
| 2020 | $1,448 +2.3% | $94,604 +2.3% |
| 2019 | $1,415 | $92,477 -9.1% |
| 2018 | $1,415 -33.6% | $101,745 +9.6% |
| 2017 | $2,132 | $92,856 +13.9% |
| 2016 | $2,132 +8.2% | $81,499 -19.6% |
| 2015 | $1,970 -1.9% | $101,308 +33.1% |
| 2014 | $2,008 +18.2% | $76,094 -5.6% |
| 2013 | $1,699 +30% | $80,591 +62.5% |
| 2012 | $1,307 +7.9% | $49,589 +9.9% |
| 2011 | $1,212 -15.3% | $45,124 -16.8% |
| 2010 | $1,431 +193.5% | $54,233 +1.4% |
| 2009 | $488 -78.4% | $53,460 -63% |
| 2008 | $2,253 -41.6% | $144,370 -25.6% |
| 2007 | $3,860 +21.6% | $194,090 +30.4% |
| 2006 | $3,174 +35.6% | $148,830 +57.2% |
| 2004 | $2,341 +49.6% | $94,650 +17.2% |
| 2003 | $1,565 -9.7% | $80,780 +12.7% |
| 2002 | $1,733 | $71,700 -0.6% |
| 2000 | -- | $72,160 |
Find assessor info on the county website
A local agent can set up tours, give advice and negotiate with sellers.
A local lender can help you make sure your offer is ready when you are.