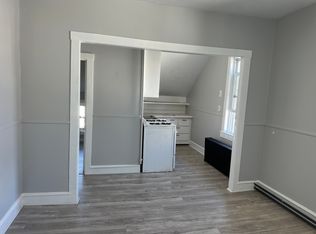
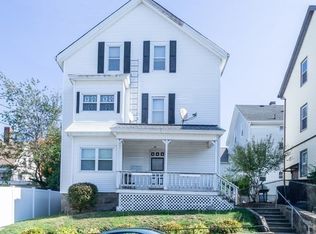
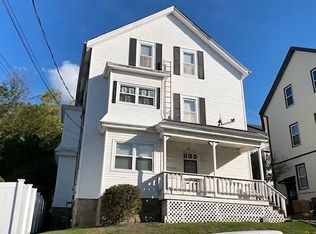
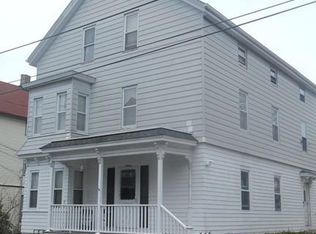
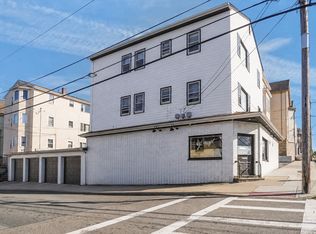
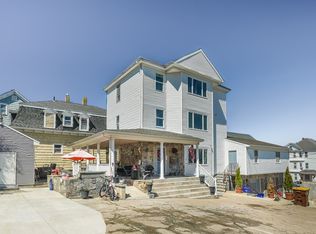
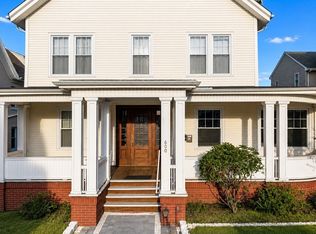
Fantastic investment opportunity in Fall River’s South End! This well-maintained 3-family property is situated on a corner lot and offers two 3-bedroom units and one 2-bedroom unit, each with functional layouts and spacious living areas. Recent updates include a new roof, and the units have been consistently maintained.Additional features include a small side yard and strong rental potential. Conveniently located near schools, shopping, dining, and major highways, providing easy access for commuting and everyday needs. Ideal for investors or owner occupants. Don't miss it!
Pending
$639,900
4 Oliver St, Fall River, MA 02724
6beds
2,952sqft
3 Family
Built in 1900
-- sqft lot
$632,400 Zestimate®
$217/sqft
$-- HOA
What's special
Small side yardCorner lotNew roofFunctional layouts
- 58 days |
- 46 |
- 0 |
Zillow last checked:
Listing updated:
Listed by:
The Vision Group 401-648-1692,
Keller Williams South Watuppa 508-677-3233,
MD Zafar 617-869-3212
Source: MLS PIN,MLS#: 73509172
Facts & features
Interior
Bedrooms & bathrooms
- Bedrooms: 6
- Bathrooms: 3
- Full bathrooms: 3
Features
- Basement: Full
- Has fireplace: No
Interior area
- Total structure area: 2,952
- Total interior livable area: 2,952 sqft
- Finished area above ground: 2,952
Property
Features
- Patio & porch: Porch
Lot
- Size: 3,363 Square Feet
- Features: Other
Details
- Parcel number: M:0G21 B:0000 L:0007,2826714
- Zoning: A-2
Construction
Type & style
- Home type: MultiFamily
- Property subtype: 3 Family
Materials
- Foundation: Stone
- Roof: Shingle
Condition
- Year built: 1900
Utilities & green energy
- Sewer: Public Sewer
- Water: Public
Community & HOA
Location
- Region: Fall River
Financial & listing details
- Price per square foot: $217/sqft
- Tax assessed value: $380,300
- Annual tax amount: $4,354
- Date on market: 4/29/2026
- Total actual rent: 0
Estimated market value
$632,400
$601,000 - $664,000
$1,865/mo
Price history
| Date | Event | Price |
|---|---|---|
| 6/4/2026 | Pending sale | $639,900$217/sqft |
Source: MLS PIN #73509172 Report a problem | ||
| 5/21/2026 | Contingent | $639,900$217/sqft |
Source: MLS PIN #73509172 Report a problem | ||
| 4/29/2026 | Listed for sale | $639,900-1.6%$217/sqft |
Source: MLS PIN #73509172 Report a problem | ||
| 11/14/2025 | Listing removed | $650,000$220/sqft |
Source: MLS PIN #73436885 Report a problem | ||
| 9/29/2025 | Listed for sale | $650,000+150%$220/sqft |
Source: MLS PIN #73436885 Report a problem | ||
| 7/16/2020 | Sold | $260,000+6.1%$88/sqft |
Source: Public Record Report a problem | ||
| 6/17/2020 | Listed for sale | $245,000+100.8%$83/sqft |
Source: Amaral & Associates RE #72664264 Report a problem | ||
| 8/7/2000 | Sold | $122,000$41/sqft |
Source: Public Record Report a problem | ||
Public tax history
| Year | Property taxes | Tax assessment |
|---|---|---|
| 2025 | $4,354 +4.4% | $380,300 +4.7% |
| 2024 | $4,172 +13.2% | $363,100 +20.9% |
| 2023 | $3,686 +11.7% | $300,400 +14.9% |
| 2022 | $3,299 -6.3% | $261,400 +2.7% |
| 2021 | $3,520 +10.5% | $254,500 +15.5% |
| 2020 | $3,185 +16.5% | $220,400 +17.5% |
| 2019 | $2,735 +3% | $187,600 +3.2% |
| 2018 | $2,656 +6.6% | $181,700 +2.1% |
| 2017 | $2,492 +1.5% | $178,000 -1.2% |
| 2016 | $2,455 +4.2% | $180,100 |
| 2015 | $2,356 -0.2% | $180,100 -4% |
| 2014 | $2,360 +1.8% | $187,600 -3.4% |
| 2013 | $2,318 +3.2% | $194,300 -5% |
| 2012 | $2,247 +1.4% | $204,600 -16.5% |
| 2010 | $2,215 +3.1% | $245,000 -8.1% |
| 2009 | $2,149 -2.8% | $266,600 -7.6% |
| 2008 | $2,212 +8.3% | $288,400 +1.4% |
| 2007 | $2,042 +12.1% | $284,400 +6.6% |
| 2006 | $1,822 +4.1% | $266,800 +15.9% |
| 2005 | $1,751 +23.9% | $230,100 +33.7% |
| 2004 | $1,413 +10.6% | $172,100 +44.4% |
| 2003 | $1,277 +8.9% | $119,200 |
| 2002 | $1,173 -1.7% | $119,200 +4.5% |
| 2000 | $1,193 +26.1% | $114,100 +10.8% |
| 1995 | $946 | $103,000 |
Find assessor info on the county website
Monthly payment
Est. payment$--/mo
Payment breakdown
Explore the cost of this home by adjusting the details. Changes won't be saved.All calculations are estimates and provided by Zillow, Inc. for informational purposes only. Actual amounts may vary.
HOA fees may include property taxes on listings classified as Co-Ops. Contact the listing agent and/or owner for fee details.
Mortgage interest rates are dependent on a number of factors, including credit score, down payment, and repayment length. Interest rate data provided by Zillow Group Marketplace, Inc. as of 1/1/1970 from various mortgage lenders with which we have lead or other similar arrangements; the Estimated Payment is an average of those rates.
See how much you could borrow to make a competitive offer.
Climate risks
Neighborhood: Sandy Beach
Nearby schools
GreatSchools rating
- 4/10Carlton M. Viveiros Elementary SchoolGrades: K-5Distance: 0.6 mi
- 2/10Matthew J Kuss Middle SchoolGrades: 6-8Distance: 0.5 mi
- 2/10B M C Durfee High SchoolGrades: 9-12Distance: 2.6 mi
A local agent can set up tours, give advice and negotiate with sellers.
A local lender can help you make sure your offer is ready when you are.

Nearby cities
Nearby neighborhoods
Nearby zip codes
Other Fall River Topics
