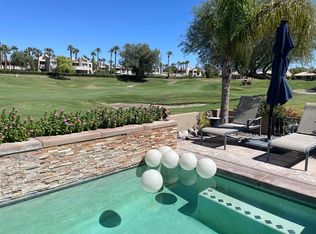
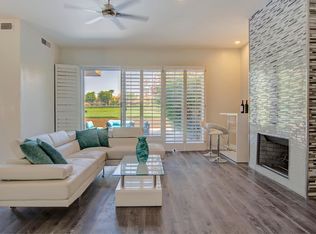
All information herein has not been verified and is not guaranteed. Buyer to verify all information.
This property is not currently displayed as for sale or rent on Zillow. This may be different from what's on other websites or public sources.
$556,900
$523,000 - $596,000
$4,785/mo
$4,785/mo
Rent Zestimate®
Find your next renter with Zillow Rental Manager. Plus, with online applications, you can quickly screen prospective tenants – for free.
$4,785/mo
Rent Zestimate®
$4,920/mo
Est. payment
Refinancing to a lower rate could help reduce your monthly payments and save thousands over the life of the loan.
$4,920/mo
Est. payment
Work with a Zillow partner agent
Leverage their expertise and Zillow's premium Showcase listings to get your home seen by more buyers.
Get startedList with your own agent
Get your home in front of millions of buyers by listing it on Zillow.
Learn how to do itSell it yourself
Take full control of how buyers see your home on Zillow by listing For Sale by Owner (FSBO).
List your homeAll information herein has not been verified and is not guaranteed. Buyer to verify all information.
This property is not currently displayed as for sale or rent on Zillow. This may be different from what's on other websites or public sources.
| Date | Event | Price |
|---|---|---|
| 2/21/2025 | Listing removed | $649,900$401/sqft |
Source:  Greater Palm Springs Realtors #219116232 Report a problem | ||
| 11/23/2024 | Price change | $649,900-7.2%$401/sqft |
Source:  CDAR/ Desert Area MLS #219116232 Report a problem | ||
| 9/4/2024 | Listed for sale | $699,999+21.7%$432/sqft |
Source: Greater Palm Springs Realtors #219116232 Report a problem | ||
| 10/30/2023 | Sold | $575,000-4%$355/sqft |
Source: CDAR/ Desert Area MLS #219097408 Report a problem | ||
| 10/24/2023 | Pending sale | $599,000$370/sqft |
Source:  CRMLS #219097408DA Report a problem | ||
| 10/6/2023 | Contingent | $599,000$370/sqft |
Source: CRMLS #219097408DA Report a problem | ||
| 9/13/2023 | Price change | $599,000-3.2%$370/sqft |
Source: Greater Palm Springs Realtors #219097408 Report a problem | ||
| 7/14/2023 | Listed for sale | $619,000+225.8%$382/sqft |
Source: Greater Palm Springs Realtors #219097408 Report a problem | ||
| 5/4/2012 | Sold | $190,000-7.1%$117/sqft |
Source: CDAR/ Desert Area MLS #21452062 Report a problem | ||
| 4/17/2012 | Price change | $204,500-2.4%$126/sqft |
Source: Windermere Real Estate Coachella Valley #21452062 Report a problem | ||
| 1/27/2012 | Price change | $209,500-7.3%$129/sqft |
Source: Winkelmann Realty #P806446 Report a problem | ||
| 12/21/2011 | Price change | $225,900-9.6%$139/sqft |
Source: Winkelmann Realty #P806446 Report a problem | ||
| 9/12/2011 | Price change | $250,000-7.4%$154/sqft |
Source: Par Realty #21422275 Report a problem | ||
| 7/5/2011 | Price change | $269,900-10%$167/sqft |
Source: Par Realty #21422275 Report a problem | ||
| 4/30/2011 | Price change | $299,900-2.9%$185/sqft |
Source: Par Realty #21422275 Report a problem | ||
| 3/2/2011 | Price change | $309,000-9%$191/sqft |
Source: Par Realty #21422275 Report a problem | ||
| 2/24/2011 | Price change | $339,500+3%$210/sqft |
Source: Visual Tour #21409270 Report a problem | ||
| 12/4/2010 | Price change | $329,500-2.9%$203/sqft |
Source: NRT California #21409270 Report a problem | ||
| 10/1/2010 | Listed for sale | $339,500$210/sqft |
Source: Visual Tour #21409270 Report a problem | ||
| Year | Property taxes | Tax assessment |
|---|---|---|
| 2026 | -- | $598,228 +2% |
| 2025 | $7,657 -1.2% | $586,499 +2% |
| 2024 | $7,748 +123.6% | $575,000 +150.7% |
| 2023 | $3,465 +2.1% | $229,372 +2% |
| 2022 | $3,392 +2.6% | $224,875 +2% |
| 2021 | $3,307 -46.1% | $220,467 +1% |
| 2020 | $6,137 +0.8% | $218,208 +2% |
| 2019 | $6,088 +0.9% | $213,930 +2% |
| 2018 | $6,036 +0.7% | $209,736 +2% |
| 2017 | $5,994 | $205,625 +2% |
| 2016 | $5,994 +111.5% | $201,594 +1.5% |
| 2015 | $2,834 +0.7% | $198,567 +2% |
| 2014 | $2,814 | $194,679 +0.5% |
| 2013 | -- | $193,800 -23.8% |
| 2012 | -- | $254,259 +2% |
| 2011 | -- | $249,274 +0.8% |
| 2010 | -- | $247,413 -0.2% |
| 2009 | -- | $248,003 +2% |
| 2008 | -- | $243,141 +2% |
| 2007 | -- | $238,375 +2% |
| 2006 | -- | $233,702 +2% |
| 2005 | -- | $229,120 +3.9% |
| 2003 | -- | $220,514 +2% |
| 2002 | -- | $216,191 +2% |
| 2001 | $2,495 +14.3% | $211,953 +15.2% |
| 2000 | $2,182 | $184,000 |