Attention builders and contractors - great opportunity to develop this downtown Natick parcel. Currently there is a 1896 Colonial in need of substantial repair located on a highly desirable corner lot. Property is zoned RG with frontage on Sherman St of 140' and frontage of 76' on Lincoln St. Short walk to downtown Natick, shops, restaurants and the train station. Act now and begin your new project later this fall/early winter.
Pending
$799,900
4 Sherman St, Natick, MA 01760
--beds
0baths
10,686Square Feet
Residential
Built in ----
10,686 Square Feet Lot
$785,700 Zestimate®
$--/sqft
$-- HOA
What's special
Highly desirable corner lot
- 31 days
- 149
- 1
Zillow last checked:
Listing updated:
Listed by:
Stephen O Loughlin 617-924-7532,
Realty Executives 617-923-7778
Source: MLS PIN,MLS#: 73583965
Facts & features
Interior
Bedrooms & bathrooms
- Bathrooms: 0
Features
- Has basement: No
Property
Features
- Frontage length: 140.00
Lot
- Size: 10,686 Square Feet
- Features: Level
Details
- Parcel number: 671696
- Zoning: RG
Utilities & green energy
- Electric: On-Site
- Gas: On-Site
- Sewer: Public Sewer
- Water: Public
Community & HOA
Community
- Features: Public Transportation, Park, T-Station
HOA
- Has HOA: No
Location
- Region: Natick
Financial & listing details
- Tax assessed value: $608,200
- Annual tax amount: $7,402
- Date on market: 9/30/2026
- Electric utility on property: Yes
Estimated market value
$785,700
$746,000 - $825,000
$3,606/mo
Price history
| Date | Event | Price |
|---|---|---|
| 10/6/2026 | Pending sale | $799,900 |
Source: MLS PIN #73583965 Report a problem | ||
| 9/29/2026 | Listed for sale | $799,900 |
Source: MLS PIN #73583965 Report a problem | ||
Public tax history
| Year | Property taxes | Tax assessment |
|---|---|---|
| 2025 | $6,674 +3.2% | $558,000 +5.8% |
| 2024 | $6,466 +3.4% | $527,400 +6.6% |
| 2023 | $6,256 +3.8% | $494,900 +9.5% |
| 2022 | $6,028 +0.2% | $451,900 +2.3% |
| 2021 | $6,014 +3.7% | $441,900 +3.7% |
| 2020 | $5,802 +7.1% | $426,300 |
| 2019 | $5,418 +8.5% | $426,300 +11.4% |
| 2018 | $4,994 +2% | $382,700 +5.4% |
| 2017 | $4,898 +3.9% | $363,100 +4.6% |
| 2016 | $4,712 +0.3% | $347,200 +2.2% |
| 2015 | $4,696 +9.1% | $339,800 +11.9% |
| 2014 | $4,306 +0% | $303,700 +1.2% |
| 2013 | $4,305 -4.2% | $300,200 -7.1% |
| 2012 | $4,494 +5.9% | $323,100 -4.1% |
| 2011 | $4,244 +4.4% | $336,800 -3.4% |
| 2010 | $4,067 +3.5% | $348,500 -1.6% |
| 2009 | $3,928 +9.8% | $354,200 -0.9% |
| 2008 | $3,578 +3% | $357,400 -1.4% |
| 2007 | $3,473 +1.9% | $362,500 +6.6% |
| 2006 | $3,408 +2% | $340,100 +7.9% |
| 2005 | $3,340 +4.2% | $315,100 |
| 2004 | $3,205 +7.8% | $315,100 +30.5% |
| 2003 | $2,974 +4.3% | $241,400 +6.9% |
| 2002 | $2,851 +12% | $225,900 +34.2% |
| 2000 | $2,545 +5.3% | $168,310 +5.2% |
| 1999 | $2,418 | $160,000 |
Find assessor info on the county website
Monthly payment
Est. payment
Payment breakdown
Explore the cost of this home by adjusting the details. Changes won't be saved.Climate risks
Neighborhood: 01760


Similar homes
- $785,0002.06 acres63 Farm Rd Lot 5, Sherborn, MA 01770Lot/Land
 MLS ID #73493068, Maryann Clancy, Berkshire Hathaway HomeServices Commonwealth Real Estate. MLS PIN
- $675,0000.81 acres240 Beaver St, Framingham, MA 01702Lot/Land
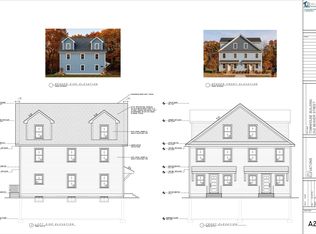 MLS ID #73593060, William Cordts, Coldwell Banker Realty - Waltham. MLS PIN
- $525,0000.46 acresLOT 1 Mill St, Framingham, MA 01701Lot/Land
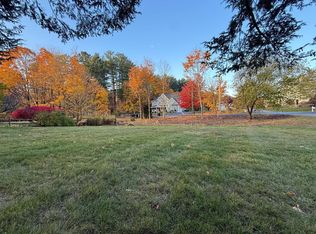 MLS ID #73596891, Camyla DaSilva, Mega Realty Services. MLS PIN
- $719,0003.52 acres147 Washington St Lot 2, Sherborn, MA 01770Lot/Land
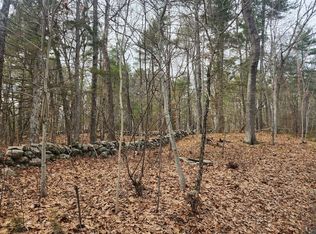 MLS ID #73493089, Maryann Clancy, Berkshire Hathaway HomeServices Commonwealth Real Estate. MLS PIN
