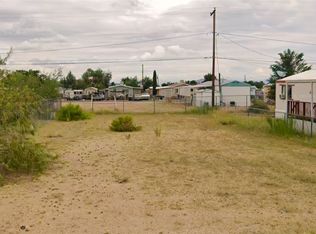
Vacant lot located in the New Kingman Addition area with approximately 0.27 acres and convenient access to Route 66, shopping, services, and other Kingman amenities. A great opportunity for a buyer looking for land in an established area. Property is being sold as vacant land. Buyer to independently verify zoning, permitted uses, utility availability and connection costs, flood zone, access, lot dimensions, and any other information material to the buyer s intended use.
Active
Price cut: $5.1K (9/22)
$29,900
4016 E Thompson Avenue, Kingman, AZ 86409
--beds
--baths
0.27Acres
Unimproved Land
Built in ----
0.27 Acres Lot
$-- Zestimate®
$--/sqft
$-- HOA
What's special
- 79 days
- 61
- 2
Likely to sell faster than
Zillow last checked:
Listing updated:
Listed by:
Melanie Stoneking 928-583-8483,
Bliss Realty & Investments
Source: Momentum MLS,MLS#: 041573 Originating MLS: Western AZ Regional Real Estate Data Exchange
Facts & features
Interior
Video & virtual tour
Property
Features
- Fencing: Chain Link
Lot
- Size: 0.27 Acres
- Dimensions: 100 x 118
- Features: Cleared, Street Level
Details
- Parcel number: 32405263A
- Zoning description: K- R1-6 Res: Sing Fam 6000sqft
Utilities & green energy
- Sewer: Septic Tank
Community & HOA
Community
- Subdivision: New Kingman Addition No 6
HOA
- Has HOA: No
Location
- Region: Kingman
Financial & listing details
- Tax assessed value: $27,686
- Date on market: 8/20/2026
- Cumulative days on market: 80 days
- Listing terms: Cash,Conventional
- Road surface type: Paved
Estimated market value
Not available
Estimated sales range
Not available
Not available
Price history
| Date | Event | Price |
|---|---|---|
| 9/22/2026 | Price change | $29,900-14.6% |
Source:  Momentum MLS #041573 Report a problem | ||
| 8/21/2026 | Listed for sale | $35,000 |
Source: Momentum MLS #041573 Report a problem | ||
Public tax history
| Year | Property taxes | Tax assessment |
|---|---|---|
| 2026 | -- | $2,769 +33.8% |
| 2025 | -- | $2,070 -12.6% |
| 2024 | $8 | $2,369 +45.6% |
| 2023 | -- | $1,627 -17.7% |
| 2022 | -- | $1,977 +1% |
| 2021 | -- | $1,958 +34.2% |
| 2019 | -- | $1,459 +166.7% |
| 2018 | -- | $547 -31.7% |
| 2017 | -- | $801 +0.3% |
| 2016 | -- | $799 -19.1% |
| 2015 | -- | $988 +8% |
| 2014 | -- | $915 -9.1% |
| 2013 | -- | $1,007 +13.3% |
| 2012 | -- | $889 -47.3% |
| 2011 | -- | $1,688 -40.6% |
| 2010 | -- | $2,842 -7.3% |
| 2009 | -- | $3,065 -2% |
| 2008 | -- | $3,129 |
| 2007 | -- | -- |
| 2006 | -- | -- |
| 2005 | -- | -- |
| 2004 | -- | -- |
| 2003 | -- | -- |
| 2002 | -- | -- |
| 2000 | -- | -- |
Find assessor info on the county website
Monthly payment
Climate risks
Neighborhood: 86409


Similar homes
- $17,0005,662 sqft3895 E Hearne Avenue, Kingman, AZ 86409Lot/Land
 MLS ID #043060, Michele Chaney, Chambers Realty Group. Momentum MLS
- $23,4009,147 sqft4604 N Patsy Drive, Kingman, AZ 86409Lot/Land
 MLS ID #040752, James Guillot, Kingman Premier Properties. Momentum MLS
- $29,7006,098 sqft2455 E Devlin Avenue, Kingman, AZ 86409Lot/Land
 MLS ID #042977, Brett Kimbal, RE/MAX Preferred Pros.. Momentum MLS
- $25,0006,534 sqft3876 E Shaeffer Avenue, Kingman, AZ 86409Lot/Land
 MLS ID #038709, Nina Mourad, Realty ONE Group Mountain Desert. Momentum MLS
- $25,00040 acres0 Apn #34101076, Kingman, AZ 86409Lot/Land
 MLS ID #203703, Tyler Vaughan, Real Broker. NAZMLS
