Income-producing property in the heart of Miami! Located at 4028 SW 11 St, this property offers a compelling investment opportunity with seller-reported gross rental income of $13,550 per month. A new roof installed in 2026, fully renovated and recently completed building recertification add to its appeal. The property features four electrical meters and one water meter, with utilities included in select rentals. Conveniently situated near Coral Gables, major employment centers, shopping and dining. An opportunity to expand your multifamily portfolio in an established Miami neighborhood. Buyers to verify income, expenses, unit configuration and permitted uses during due diligence.
For sale
$1,950,000
4028 SW 11th St, Miami, FL 33134
3beds
2baths
3,836sqft
Quadruplex
Built in 1925
-- sqft lot
$1,797,000 Zestimate®
$508/sqft
$-- HOA
What's special
Fully renovated
- 29 days
- 208
- 10
Zillow last checked:
Listing updated:
Listed by:
Yoana Toth 786-402-2514,
Toth Real Estate Group
Source: MIAMI,MLS#: A12108031 Originating MLS: A-Miami Association of REALTORS
Facts & features
Interior
Bedrooms & bathrooms
- Bedrooms: 3
- Bathrooms: 2
Heating
- Other
Cooling
- Other
Interior area
- Total structure area: 2,384
- Total interior livable area: 3,836 sqft
Video & virtual tour
Property
Parking
- Total spaces: 8
Features
- Stories: 2
Lot
- Features: Less Than 1/4 Acre Lot
Details
- Parcel number: 3041080380150
- Zoning: 5700
Construction
Type & style
- Home type: MultiFamily
- Property subtype: Quadruplex
Materials
- CBS Construction, Other
- Roof: Flat Roof With Facade Front
Condition
- Year built: 1925
Utilities & green energy
- Sewer: Public Sewer
- Water: Municipal Water
Community & HOA
Community
- Subdivision: Le Jeune Addn Sec 1
HOA
- Has HOA: No
Location
- Region: Miami
Financial & listing details
- Price per square foot: $508/sqft
- Tax assessed value: $849,718
- Annual tax amount: $11,700
- Date on market: 10/17/2026
- Listing terms: All Cash,Conventional
- Total actual rent: 162600
Estimated market value
$1,797,000
$1.71M - $1.89M
$3,390/mo
Price history
| Date | Event | Price |
|---|---|---|
| 10/19/2026 | Listed for sale | $1,950,000+2.9%$508/sqft |
Source:  MIAMI #A12108031 Report a problem | ||
| 3/25/2026 | Listing removed | $1,895,000$494/sqft |
Source: MIAMI #A11978972 Report a problem | ||
| 3/11/2026 | Listed for sale | $1,895,000+86036.4%$494/sqft |
Source: MIAMI #A11978972 Report a problem | ||
| 3/11/2026 | Listing removed | $1,400 |
Source: MIAMI #A11978969 Report a problem | ||
| 3/9/2026 | Listed for rent | $1,400-39.1% |
Source: MIAMI #A11978969 Report a problem | ||
| 12/15/2025 | Listing removed | $2,300$1/sqft |
Source: Zillow Rentals Report a problem | ||
| 12/11/2025 | Price change | $2,300+21.1%$1/sqft |
Source: Zillow Rentals Report a problem | ||
| 12/8/2025 | Price change | $1,900-9.5% |
Source: MIAMI #A11913194 Report a problem | ||
| 11/21/2025 | Price change | $2,100-8.7%$1/sqft |
Source: MIAMI #A11913194 Report a problem | ||
| 11/21/2025 | Price change | $2,300+4.5%$1/sqft |
Source: MIAMI #A11906542 Report a problem | ||
| 11/12/2025 | Listing removed | $2,200$1/sqft |
Source: MIAMI #A11910734 Report a problem | ||
| 11/8/2025 | Listed for sale | $2,200-99.8%$1/sqft |
Source: MIAMI #A11910734 Report a problem | ||
| 11/1/2025 | Price change | $2,200-12%$1/sqft |
Source: MIAMI #A11906554 Report a problem | ||
| 11/1/2025 | Listed for rent | $2,500$1/sqft |
Source: MIAMI #A11906542 Report a problem | ||
| 6/11/2025 | Sold | $1,025,000$267/sqft |
Source: Public Record Report a problem | ||
Public tax history
| Year | Property taxes | Tax assessment |
|---|---|---|
| 2025 | $11,765 +4.1% | $484,382 +10% |
| 2024 | $11,298 +13.8% | $440,348 +10% |
| 2023 | $9,930 -4.4% | $400,317 -27.1% |
| 2022 | $10,386 +2.6% | $549,235 +10% |
| 2021 | $10,125 +14.9% | $499,305 +10% |
| 2020 | $8,809 +3.2% | $453,914 +3.8% |
| 2019 | $8,537 +26.8% | $437,359 +52.3% |
| 2018 | $6,731 | $287,130 +10% |
| 2017 | $6,731 +2.5% | $261,028 +10% |
| 2016 | $6,564 -0.9% | $237,299 +1.9% |
| 2015 | $6,624 +36.4% | $232,925 +10% |
| 2014 | $4,857 -14.1% | $211,750 -3.4% |
| 2013 | $5,655 | $219,249 -17.6% |
| 2012 | $5,655 +3.7% | $266,200 +10% |
| 2011 | $5,455 -11.7% | $242,000 -9.3% |
| 2010 | $6,181 -3.9% | $266,860 -11.7% |
| 2009 | $6,430 -14.6% | $302,151 -17.5% |
| 2007 | $7,526 +22.4% | $366,419 |
| 2006 | $6,151 | -- |
| 2005 | $6,151 +14% | -- |
| 2004 | $5,396 +55.3% | -- |
| 2003 | $3,475 +37.3% | -- |
| 2002 | $2,530 -20.5% | -- |
| 2001 | $3,181 | -- |
Find assessor info on the county website
Monthly payment
Est. payment
Payment breakdown
Explore the cost of this home by adjusting the details. Changes won't be saved.Climate risks
Neighborhood: 33134


Similar homes
- $1,950,0004 bd4 ba2.3k sqftCoral Gable Country Club, Coral Gables, FL 33134For Sale
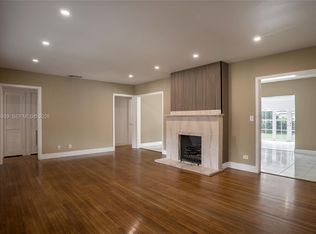
 MLS ID #A12116939, Marina Osmacova, MIAMI VIP REALTY LLC. MIAMI
- $1,825,0006 bd4 ba2.4k sqftGables Manor Sub, Miami, FL 33134For Sale
 MLS ID #A11928889, Alejandro Infante Vidal, Premium Estates Realty Corp. MIAMI
- $1,250,0005 bd4 ba2.1k sqftCoral Groves, Miami, FL 33134For Sale
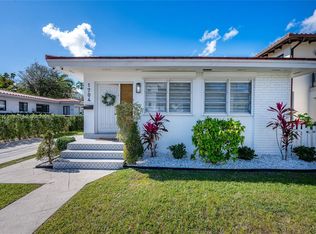 MLS ID #A12081159, Sean Guim, Onyx Realty. MIAMI
- $1,800,0006 bd4 ba2.3k sqftCleveland Terrace, Miami, FL 33145For Sale
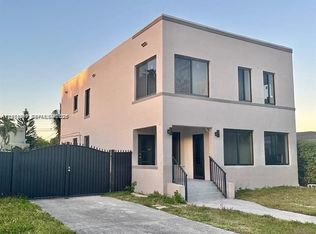 MLS ID #A12100569, Fernando Villagran, Partnership Realty Inc.. MIAMI
- $1,740,0003 bd4 ba2k sqftCoral Way Pk Sec D, Miami, FL 33155For SaleMLS ID #A12095188, Robert Martinez, JJRM Realty Group. MIAMI
- $1,425,0006 bd3 ba3.9k sqftShenandoah, Miami, FL 33135For SaleMLS ID #A12088347, Julio Rios, Avenew Realty Corp. MIAMI
- $1,450,0002 bd1 ba3.3k sqftLawrence Estate Land Co, Miami, FL 33130For SaleMLS ID #A12108574, Matthew Krinzman, One Sotheby's International Realty. MIAMI
- $2,050,0006 bd6 ba2.4k sqftUniversity Mnr, Miami, FL 33143For SaleMLS ID #A12071546, Maria Castellano, LUX International Realty, LLC. MIAMI
- $1,790,0004 bd3 ba2.4k sqftGrapeland Hgts, Miami, FL 33142For SaleMLS ID #A12074466, Phillip Guerrero, First Premier Realty Corp.. MIAMI
- $1,200,0003 bd3 ba1.9k sqftCitrus Park, Miami, FL 33135For SaleMLS ID #A12081357, Maria Marianeschi, Binter Real Estate. MIAMI
- $2,200,0003 bd2 ba3.4k sqftSubdivision Of, Miami, FL 33173For SaleMLS ID #A12078012, Darious White, Trustpoint Realty, LLC.. MIAMI
- $1,200,0004 bd4 ba2.4k sqftAlta Terra, South Miami, FL 33155For SaleMLS ID #A12090321, Sofia Giraldo, Compass Florida, LLC. MIAMI
- $1,298,0005 bd4 ba2.4k sqftGrapeland, Miami, FL 33145For SaleMLS ID #A12052250, Luiza Renuart, Elite Ocean View Realty LLC. MIAMI
- $2,400,0006 bd6 ba4.6k sqftEspanola Villas 1st Addn, Miami Beach, FL 33139For SaleMLS ID #A12023899, Jordan Lederman, Fortune International Realty. MIAMI
- $1,050,0006 bd4 ba2.9k sqft1853 NW 5th Street, Miami, FL 33125For Sale
 MLS ID #B26071643, Hilda Gonzalez, LoKation. BeachesMLS
- $2,300,0004 bd3 ba4.4k sqftMiller Drive Estates, Miami, FL 33173For SaleMLS ID #A12078303, Darious White, Trustpoint Realty, LLC.. MIAMI
- $1,075,0004 bd5 ba1.9k sqftSilver Bluff Est Sec C, Miami, FL 33133For SaleMLS ID #A12112894, Daniel Burdak, Brickell Investment Realty. MIAMI
- $1,279,0006 bd4 ba2.9k sqftOverbrook Park, Miami, FL 33133For SaleMLS ID #A12066664, Jonathan Minerick, HomeCoin.com. MIAMI
- $1,250,0005 bd7 ba3.3k sqftWaldin Acres, Miami, FL 33125For SaleMLS ID #A11958845, Michelle Real, Avenuewest Miami. MIAMI
- $1,100,0005 bd3 ba2.5k sqftOverbrook Park, Miami, FL 33133For SaleMLS ID #A12098304, Gerardo Gonzalez, Compass Florida, LLC. MIAMI
