This 1155 square foot single family home has 3 bedrooms and 2.0 bathrooms. This home is located at 4098 Fernleaf Dr, Las Vegas, NV 89115.
Pre-foreclosure
Street View
Est. $362,500
4098 Fernleaf Dr, Las Vegas, NV 89115
3beds
2baths
1,155sqft
SingleFamily
Built in 1977
6,534 Square Feet Lot
$362,500 Zestimate®
$314/sqft
$-- HOA
Overview
- 116 days
- 24
- 1
Facts & features
Interior
Bedrooms & bathrooms
- Bedrooms: 3
- Bathrooms: 2
Heating
- Forced air
Cooling
- Central
Features
- Flooring: Carpet, Concrete, Linoleum / Vinyl
Interior area
- Total interior livable area: 1,155 sqft
Property
Parking
- Parking features: Garage - Attached
Features
- Exterior features: Stucco
Lot
- Size: 6,534 Square Feet
Details
- Parcel number: 14006813038
Construction
Type & style
- Home type: SingleFamily
Materials
- Frame
- Roof: Composition
Condition
- Year built: 1977
Community & HOA
Location
- Region: Las Vegas
Financial & listing details
- Price per square foot: $314/sqft
- Tax assessed value: $148,889
- Annual tax amount: $1,295
Foreclosure details
Estimated market value
$362,500
$344,000 - $381,000
$2,011/mo
Price history
| Date | Event | Price |
|---|---|---|
| 4/11/2022 | Sold | $326,000-5%$282/sqft |
Source:  LVR #2328281 Report a problem | ||
| 2/25/2022 | Pending sale | $343,000$297/sqft |
Source: LVR #2328281 Report a problem | ||
| 2/17/2022 | Listed for sale | $343,000$297/sqft |
Source: LVR #2328281 Report a problem | ||
| 1/14/2022 | Pending sale | $343,000$297/sqft |
Source: LVR #2328281 Report a problem | ||
| 11/16/2021 | Listed for sale | $343,000$297/sqft |
Source: LVR #2328281 Report a problem | ||
| 11/8/2021 | Pending sale | $343,000$297/sqft |
Source: LVR #2328281 Report a problem | ||
| 10/1/2021 | Price change | $343,000-1.7%$297/sqft |
Source: LVR #2328281 Report a problem | ||
| 9/17/2021 | Price change | $349,000-0.9%$302/sqft |
Source: LVR #2328281 Report a problem | ||
| 8/30/2021 | Listed for sale | $352,000+11.7%$305/sqft |
Source: LVR #2328281 Report a problem | ||
| 8/2/2021 | Sold | $315,000-7.4%$273/sqft |
Source: LVR #2313603 Report a problem | ||
| 7/17/2021 | Pending sale | $339,990$294/sqft |
Source: LVR #2313603 Report a problem | ||
| 7/10/2021 | Listed for sale | $339,990+30.7%$294/sqft |
Source: LVR #2313603 Report a problem | ||
| 5/17/2021 | Sold | $260,200+0.1%$225/sqft |
Source: LVR #2285405 Report a problem | ||
| 4/15/2021 | Pending sale | $260,000$225/sqft |
Source: LVR #2285405 Report a problem | ||
| 4/8/2021 | Listed for sale | $260,000+108%$225/sqft |
Source: LVR #2285405 Report a problem | ||
| 5/23/2019 | Sold | $125,000+34.4%$108/sqft |
Source: Public Record Report a problem | ||
| 6/6/2018 | Sold | $93,000-17.7%$81/sqft |
Source: Public Record Report a problem | ||
| 3/12/2018 | Sold | $113,000$98/sqft |
Source: Public Record Report a problem | ||
| 4/23/2013 | Sold | $113,000+0.9%$98/sqft |
Source: Public Record Report a problem | ||
| 11/20/2012 | Sold | $111,955-5.9%$97/sqft |
Source: Public Record Report a problem | ||
| 5/13/2011 | Sold | $119,000$103/sqft |
Source: Public Record Report a problem | ||
Public tax history
| Year | Property taxes | Tax assessment |
|---|---|---|
| 2026 | $1,295 +7.9% | $52,111 -1.9% |
| 2025 | $1,200 +47.5% | $53,132 -0.5% |
| 2024 | $814 +8% | $53,380 +16.2% |
| 2023 | $754 +7% | $45,936 +8.1% |
| 2022 | $704 +8.8% | $42,484 +1.6% |
| 2021 | $648 +6.8% | $41,813 +8.9% |
| 2020 | $607 -19.6% | $38,382 +4% |
| 2019 | $754 +21.4% | $36,917 |
| 2018 | $621 | $36,917 +2.8% |
| 2017 | $621 | $35,928 +9.1% |
| 2016 | $621 +15.2% | $32,946 +7.3% |
| 2015 | $539 +3.2% | $30,691 +77.6% |
| 2014 | $523 | $17,280 |
| 2013 | -- | $17,280 -13.7% |
| 2012 | -- | $20,027 -8.4% |
| 2011 | -- | $21,854 +3% |
| 2010 | -- | $21,211 -24.1% |
| 2009 | -- | $27,928 |
| 2008 | -- | $27,928 -54.8% |
| 2007 | -- | $61,724 +31.6% |
| 2006 | -- | $46,903 +29% |
| 2005 | -- | $36,372 +8.8% |
| 2004 | -- | $33,443 +3.3% |
| 2003 | -- | $32,389 +5.4% |
| 2002 | -- | $30,720 +11.4% |
| 2001 | -- | $27,570 |
Find assessor info on the county website
Monthly payment
Climate risks
Neighborhood: Sunrise Manor
Similar homes
- $338,0004 bd2 ba1.1k sqft4016 Briar Ct, Las Vegas, NV 89115For Sale
 MLS ID #2811139, Karla A. Trevino, Simply Vegas. LVR
- $325,0003 bd3 ba1.4k sqft4044 Rocky Beach Dr, Las Vegas, NV 89115For Sale
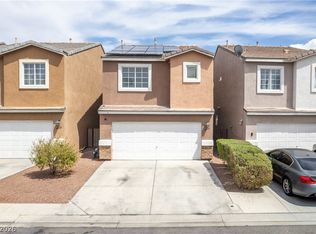 MLS ID #2826609, Esteban Ordonez, Vice Realty. LVR
- $330,0003 bd2 ba1.5k sqft4166 Tolkien Ave, Las Vegas, NV 89115For Sale
 MLS ID #2825591, Javier M. Mendez, LPT Realty, LLC. LVR
- $325,0003 bd2 ba1.1k sqft4364 Calimesa St, Las Vegas, NV 89115For Sale
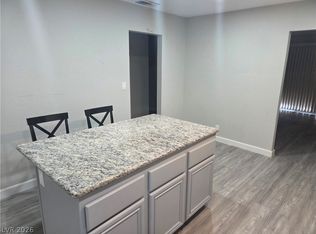 MLS ID #2824493, Christopher Miller, THE Brokerage A RE Firm. LVR
