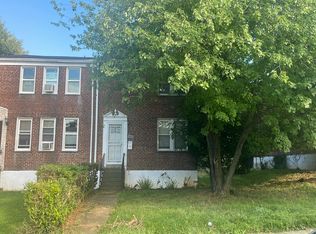
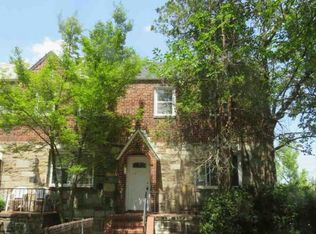
This 1222 square foot single family home has 3 bedrooms and 2.0 bathrooms. This home is located at 4103 Callaway Ave, Baltimore, MD 21215.
Foreclosed
Street View
Est. $209,500
4103 Callaway Ave, Baltimore, MD 21215
3beds
1,222sqft
SingleFamily
Built in 1940
3,704 Square Feet Lot
$209,500 Zestimate®
$171/sqft
$-- HOA
Overview
- 21 days
- 27
- 0
Facts & features
Interior
Bedrooms & bathrooms
- Bedrooms: 3
- Bathrooms: 2
- Full bathrooms: 1
- 1/2 bathrooms: 1
Heating
- Forced air, Gas
Appliances
- Included: Dishwasher, Refrigerator
Features
- Flooring: Tile, Carpet, Concrete, Laminate
- Basement: Partially finished
- Has fireplace: Yes
Interior area
- Total interior livable area: 1,222 sqft
Property
Parking
- Parking features: On-street
Features
- Exterior features: Brick
Lot
- Size: 3,704 Square Feet
Details
- Parcel number: 15212951A033A
Construction
Type & style
- Home type: SingleFamily
Materials
- brick
- Roof: Built-up
Condition
- Year built: 1940
Community & HOA
Location
- Region: Baltimore
Financial & listing details
- Price per square foot: $171/sqft
- Tax assessed value: $154,900
- Annual tax amount: $3,656
Foreclosure details
Estimated market value
$209,500
$186,000 - $228,000
$1,764/mo
Price history
| Date | Event | Price |
|---|---|---|
| 10/21/2026 | Sold | $153,340+27.8%$125/sqft |
Source: Public Record Report a problem | ||
| 1/25/2024 | Listing removed | -- |
Source: Zillow Rentals Report a problem | ||
| 1/6/2024 | Price change | $1,900-9.5%$2/sqft |
Source: Zillow Rentals Report a problem | ||
| 11/27/2023 | Listed for rent | $2,100+50%$2/sqft |
Source: Zillow Rentals Report a problem | ||
| 10/18/2023 | Sold | $120,000-0.4%$98/sqft |
Source: Public Record Report a problem | ||
| 3/4/2016 | Listing removed | $120,500$99/sqft |
Source: Glen Burnie - WEICHERT, REALTORS - Platinum Service #BA8764403 Report a problem | ||
| 2/17/2016 | Price change | $120,500-1.6%$99/sqft |
Source: Glen Burnie - WEICHERT, REALTORS - Platinum Service #BA8764403 Report a problem | ||
| 1/1/2016 | Price change | $122,500-2%$100/sqft |
Source: Glen Burnie - WEICHERT, REALTORS - Platinum Service #BA8764403 Report a problem | ||
| 12/4/2015 | Price change | $125,000-3.1%$102/sqft |
Source: Glen Burnie - WEICHERT, REALTORS - Platinum Service #BA8764403 Report a problem | ||
| 11/12/2015 | Price change | $129,000-0.7%$106/sqft |
Source: Glen Burnie - WEICHERT, REALTORS - Platinum Service #BA8764403 Report a problem | ||
| 10/4/2015 | Listed for sale | $129,900+5804.5%$106/sqft |
Source: Weichert Realtors Platinum Service #BA8764403 Report a problem | ||
| 5/1/2014 | Listing removed | $1,400$1/sqft |
Source: Weichert, Realtors Platinum Service #BA8279492 Report a problem | ||
| 2/17/2014 | Listed for rent | $1,400$1/sqft |
Source: Go Section8 Report a problem | ||
| 4/25/2013 | Sold | $2,200-98.5%$2/sqft |
Source: Public Record Report a problem | ||
| 12/4/2008 | Listing removed | $145,900$119/sqft |
Source: Long and Foster Real Estate #BA6899806 Report a problem | ||
| 10/19/2008 | Listed for sale | $145,900+224.2%$119/sqft |
Source: Long and Foster Real Estate #BA6899806 Report a problem | ||
| 3/27/2008 | Sold | $45,000$37/sqft |
Source: Public Record Report a problem | ||
Public tax history
| Year | Property taxes | Tax assessment |
|---|---|---|
| 2026 | $3,656 +15.7% | $154,900 +15.7% |
| 2025 | $3,160 +5.8% | $133,900 +5.8% |
| 2024 | $2,986 +6.2% | $126,533 +6.2% |
| 2023 | $2,812 +6.6% | $119,167 +6.6% |
| 2022 | $2,638 +0.2% | $111,800 +0.2% |
| 2021 | $2,633 +0.2% | $111,567 +0.2% |
| 2020 | $2,627 +0.2% | $111,333 +0.2% |
| 2019 | $2,622 | $111,100 |
| 2018 | $2,622 | $111,100 |
| 2017 | $2,622 -6.4% | $111,100 -1.9% |
| 2016 | $2,802 | $113,200 |
| 2015 | $2,802 | $113,200 |
| 2014 | $2,802 | $113,200 -4.3% |
| 2013 | -- | $118,300 |
| 2012 | -- | $118,300 |
| 2011 | -- | $118,300 -14.9% |
| 2010 | -- | $139,070 +19.2% |
| 2009 | -- | $116,646 +23.8% |
| 2008 | -- | $94,223 +31.2% |
| 2007 | -- | $71,800 +2.1% |
| 2006 | -- | $70,300 +2.2% |
| 2005 | -- | $68,800 +2.2% |
| 2004 | -- | $67,300 +3.4% |
| 2003 | -- | $65,080 +3.5% |
| 2002 | -- | $62,860 +3.7% |
| 2001 | -- | $60,640 |
Find assessor info on the county website
Monthly payment
Climate risks
Neighborhood: Dolfield
Similar homes
- $--3 bd2 ba1.3k sqft4047 Annellen Rd, Baltimore, MD 21215Auction
 Auction.com 2
- $--3 bd3 ba1.7k sqft4012 W Cold Spring Ln, Baltimore, MD 21215Auction
 Auction.com 2
- $--3 bd1 ba1.4k sqft3730 Columbus Dr, Baltimore, MD 21215Auction
 Auction.com 1
- $209,0003 bd1 ba1.4k sqft3814 Callaway Ave, Baltimore, MD 21215For Sale

 MLS ID #MDBA2228742, Alex Fox, Allfirst Realty, Inc.. Bright MLS
- $194,9003 bd2 ba1.2k sqft4579 Derby Manor Dr, Baltimore, MD 21215For SaleMLS ID #MDBA2234278, David Pridgen, Jr., Realty ONE Group Excellence. Bright MLS
- $215,0003 bd4 ba1.4k sqft3709 Arcadia Ave, Baltimore, MD 21215For SaleMLS ID #MDBA2233982, Jehri Boseman, Keller Williams Legacy. Bright MLS
- $239,0003 bd-- ba1.3k sqft4048 Edgewood Rd, Baltimore, MD 21215For SaleMLS ID #MDBA2233686, Ms. Molly Krief, Corner House Realty. Bright MLS
- $230,0004 bd2 ba1k sqft3712 Bowers Ave, Baltimore, MD 21207For SaleMLS ID #MDBA2237184, April Johnson, Shoiyia Signature Group. Bright MLS
- $190,0003 bd3 ba1.3k sqft4505 Park Heights Ave, Baltimore, MD 21215For SaleMLS ID #MDBA2235754, Wiley WILEY, Northrop Realty. Bright MLS
- $245,0004 bd3 ba1.8k sqft3827 Cottage Ave, Baltimore, MD 21215For SaleMLS ID #MDBA2237564, Jeremey Weiss, Keller Williams Flagship. Bright MLS
- $218,9993 bd3 ba1.6k sqft4308 Pimlico Rd, Baltimore, MD 21215For SaleMLS ID #MDBA2235528, Liz Ancel, Cummings & Co. Realtors. Bright MLS
- $206,0003 bd2 ba1.6k sqft3968 Dolfield Ave, Baltimore, MD 21215For SaleMLS ID #MDBA2224474, Tonee Young, Berkshire Hathaway HomeServices PenFed Realty. Bright MLS
