Turnkey income-producing quadplex opportunity offering immediate cash flow and long-term investment stability. This well-maintained 3,870 SF multifamily property consists of four fully leased 2-bedroom / 1-bath units, each generating $1,400 per month in rental income, providing investors with a strong and consistent revenue stream from day one. between 2021 and 2024, the property underwent extensive improvements including a new roof, fully remodeled interiors with updated flooring, cabinets, and modern finishes, along with substantial upgrades to the plumbing and electrical systems. With major capital improvements already completed and stable in-place tenancy, this property presents an exceptional low-maintenance investment opportunity with strong income potential and long-term upside. Ideal for investors seeking a truly turnkey multifamily asset with immediate returns.
For sale
Price cut: $20.1K (8/6)
$679,900
4111 SE 22ND AVENUE, OCALA, FL 34480
8beds
4baths
3,870sqft
Quadruplex, Multi Family
Built in 1981
-- sqft lot
$-- Zestimate®
$176/sqft
$-- HOA
What's special
Modern finishesNew roofFully remodeled interiorsUpdated flooring
- 155 days
- 116
- 12
Zillow last checked:
Listing updated:
Listed by:
Joshua Markham 352-300-6913,
WIECHENS REALTY INC 352-622-3214
Source: Stellar MLS,MLS#: OM725155 Originating MLS: Ocala - Marion
Facts & features
Interior
Bedrooms & bathrooms
- Bedrooms: 8
- Bathrooms: 4
Heating
- Central
Cooling
- Central Air
Appliances
- Laundry: Laundry Room
Features
- Ceiling Fan(s), Thermostat, Walk-In Closet(s)
- Has fireplace: No
Interior area
- Total structure area: 3,870
- Total interior livable area: 3,870 sqft
Video & virtual tour
Property
Features
- Exterior features: None
Lot
- Size: 0.33 Acres
- Dimensions: 120 x 120
Details
- Parcel number: 3120011009
- Zoning: R1
- Special conditions: None
Construction
Type & style
- Home type: MultiFamily
- Property subtype: Quadruplex, Multi Family
Materials
- Wood Siding
- Foundation: Slab
- Roof: Shingle
Condition
- New construction: No
- Year built: 1981
Utilities & green energy
- Sewer: Public Sewer
- Water: Public
- Utilities for property: Cable Available, Electricity Available, Sewer Available, Water Available
Community & HOA
Community
- Pet fee: $0 monthly
- Subdivision: CITRUS PARK
HOA
- Has HOA: No
Location
- Region: Ocala
Financial & listing details
- Price per square foot: $176/sqft
- Tax assessed value: $367,200
- Annual tax amount: $6,764
- Date on market: 5/21/2026
- Cumulative days on market: 124 days
- Ownership: Fee Simple
- Total actual rent: 0
- Electric utility on property: Yes
- Road surface type: Asphalt, Concrete
Estimated market value
Not available
Estimated sales range
Not available
Not available
Price history
| Date | Event | Price |
|---|---|---|
| 8/6/2026 | Price change | $679,900-2.9%$176/sqft |
Source:  Stellar MLS #OM725155 Report a problem | ||
| 5/21/2026 | Listed for sale | $699,999+150.9%$181/sqft |
Source: Stellar MLS #OM725155 Report a problem | ||
| 6/28/2021 | Sold | $279,000+39.5%$72/sqft |
Source: Public Record Report a problem | ||
| 4/26/2019 | Sold | $200,000+135.3%$52/sqft |
Source: Public Record Report a problem | ||
| 1/31/2014 | Sold | $85,000+112.5%$22/sqft |
Source: Public Record Report a problem | ||
| 1/24/2013 | Sold | $40,000$10/sqft |
Source: Public Record Report a problem | ||
Public tax history
| Year | Property taxes | Tax assessment |
|---|---|---|
| 2025 | $6,764 +11.1% | $266,093 +10% |
| 2024 | $6,090 +4.3% | $241,903 +10% |
| 2023 | $5,839 +12.9% | $219,912 +10% |
| 2022 | $5,170 +7.4% | $199,920 +16.7% |
| 2021 | $4,813 +3.9% | $171,360 +7.7% |
| 2020 | $4,632 +9% | $159,120 +18.4% |
| 2019 | $4,250 | $134,405 +8.9% |
| 2018 | $4,250 +12.4% | $123,420 +10% |
| 2017 | $3,781 +46.4% | $112,200 +11.1% |
| 2016 | $2,582 | $100,980 +10% |
| 2015 | $2,582 +9.5% | $91,800 +11.1% |
| 2014 | $2,359 +1.4% | $82,620 +1.3% |
| 2013 | $2,326 -9% | $81,600 -15.8% |
| 2012 | $2,556 -10.6% | $96,900 -16.7% |
| 2011 | $2,860 -12.3% | $116,280 -18.6% |
| 2010 | $3,261 -5.7% | $142,800 -11.1% |
| 2009 | $3,459 -14.2% | $160,650 -21.1% |
| 2008 | $4,031 -3.3% | $203,490 -5% |
| 2007 | $4,167 +1.3% | $214,200 +12.3% |
| 2006 | $4,113 +62.7% | $190,740 +33.6% |
| 2005 | $2,527 | $142,800 +47.5% |
| 2004 | $2,527 +24% | $96,828 +19.9% |
| 2002 | $2,038 +4.9% | $80,784 +2.9% |
| 2001 | $1,943 | $78,540 |
| 2000 | $1,943 | $78,540 |
Find assessor info on the county website
Monthly payment
Est. payment
Payment breakdown
Explore the cost of this home by adjusting the details. Changes won't be saved.Climate risks
Neighborhood: 34480


Similar homes
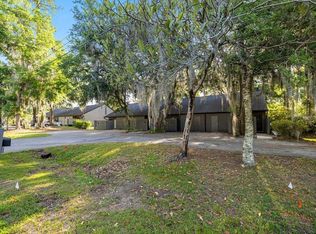
- $679,9008 bd4 ba3.9k sqft4151 SE 22ND AVENUE, OCALA, FL 34480For Sale
 MLS ID #OM725149, Joshua Markham, WIECHENS REALTY INC. Stellar MLS
- $564,0008 bd4 ba3.2k sqft2000 SE 40TH STREET ROAD, OCALA, FL 34480For Sale
 MLS ID #OM717086, Freddy Pinero, LOKATION. Stellar MLS
- $564,0008 bd4 ba3.2k sqft1820 SE 40TH STREET ROAD, OCALA, FL 34480For Sale
 MLS ID #OM717087, Freddy Pinero, LOKATION. Stellar MLS
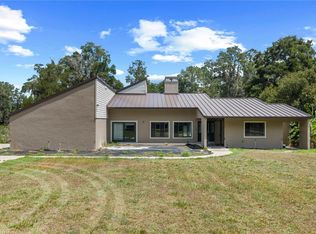
- $769,0005 bd4 ba3.3k sqft3261 SE 41ST PLACE, OCALA, FL 34480For Sale
 MLS ID #OM728800, Tamara Myers, ENGEL & VOLKERS OCALA. Stellar MLS
- $749,9005 bd4 ba4.2k sqft4370 SE 26TH TERRACE ROAD, OCALA, FL 34480For SaleMLS ID #OM727708, Kendrick Butler, STELLAR REAL ESTATE AGENCY LLC. Stellar MLS
- $575,9008 bd8 ba3.4k sqft2950 SE 53RD COURT, OCALA, FL 34480For SaleMLS ID #TB8498918, Tina White, EXP REALTY LLC. Stellar MLS
- $539,5008 bd8 ba3.4k sqft3050 SE 53RD COURT, OCALA, FL 34480For SaleMLS ID #TB8507275, Paul Jayabalan Vincent, AVENUE HOMES LLC. Stellar MLS
- $599,9005 bd3 ba2.9k sqft2151 SE 59TH STREET, OCALA, FL 34480For SaleMLS ID #OM703624, Ernest Martinez, EVM TOTAL REAL ESTATE SOLUTION. Stellar MLS
- $735,0005 bd4 ba4.1k sqft3575 SW 24TH AVENUE ROAD, OCALA, FL 34471For SaleMLS ID #W7890167, Ralph Harvey, LISTWITHFREEDOM.COM. Stellar MLS
- $499,0006 bd4 ba3k sqft5160 SE 29TH STREET, OCALA, FL 34480For SaleMLS ID #OM727363, John Amerson, UNLOCK REALTY GROUP INC. Stellar MLS
- $485,0006 bd4 ba3k sqft5121 SE 30TH STREET, OCALA, FL 34480For SaleMLS ID #O6428231, Gilles Durandisse, THE C SMITH REAL ESTATE GROUP LLC. Stellar MLS
- $489,9006 bd5 ba3.9k sqft4520 SE 30TH STREET, OCALA, FL 34480For SaleMLS ID #OM733751, Andrew McIntosh, COME HOME REALTY GROUP, LLC. Stellar MLS
- $493,7806 bd5 ba3.9k sqft2927 SE 46TH AVENUE, OCALA, FL 34480For SaleMLS ID #OM726065, Tamara Myers, ENGEL & VOLKERS OCALA. Stellar MLS
- $426,9006 bd5 ba3.9k sqft4517 SE 31ST PLACE, OCALA, FL 34480For SaleMLS ID #OM729512, James Hinson, PA, FLORIDA ADVANTAGE REALTY GROUP. Stellar MLS
- $660,0005 bd4 ba3.3k sqft525 SE 61ST COURT, OCALA, FL 34472For SaleMLS ID #OM725327, Danielle Thornton, KELLER WILLIAMS CORNERSTONE RE. Stellar MLS
- $749,0007 bd3 ba3k sqft10291 W 40 HIGHWAY, OCALA, FL 34482For SaleMLS ID #OM710633, Stacy Larsson, OCALA HORSE PROPERTIES, LLC. Stellar MLS
- $920,0005 bd4 ba3.9k sqft6581 S MAGNOLIA AVENUE, OCALA, FL 34471For SaleMLS ID #OM710504, Lucinda Striker, COMPASS FLORIDA LLC. Stellar MLS
- $899,0005 bd4 ba3.3k sqft2830 SE 31ST STREET, OCALA, FL 34471For SaleMLS ID #GC529042, Heather Damron, FLORIDA HOMES REALTY & MORTGAGE GVILLE. Stellar MLS
- $699,9006 bd4 ba2.3k sqft7640 SW 14TH STREET, OCALA, FL 34474New ConstructionMLS ID #OM726951, Eric Nathanson, TRANS GLOBAL REALTY, INC. Stellar MLS
