Very well-maintained mobile home featuring 3 bedrooms and 2 bathrooms, recently updated and move-in ready! Great location near shopping centers and a beautiful park. Enjoy the added convenience of a community pool and clubhouse. A wonderful opportunity for comfortable living in a great community!
Pending
Price increase: $10K (10/5)
$69,900
415 N Akers Street, Visalia, CA 93291
3beds
1,166sqft
Mobile Home, Manufactured Home
Built in 1990
-- sqft lot
$-- Zestimate®
$60/sqft
$-- HOA
What's special
- 68 days
- 347
- 22
Zillow last checked:
Listing updated:
Listed by:
Mark Avedian 559-303-1322,
Avedian Properties Company
Source: TCMLS,MLS#: 243442
Facts & features
Interior
Bedrooms & bathrooms
- Bedrooms: 3
- Bathrooms: 2
- Full bathrooms: 2
Heating
- Central
Cooling
- Central Air
Appliances
- Laundry: Inside
Features
- Flooring: Carpet
Interior area
- Total structure area: 1,166
- Total interior livable area: 1,166 sqft
Property
Features
- Stories: 1
- Has private pool: Yes
- Pool features: Community
Details
- Parcel number: 085010037000
Construction
Type & style
- Home type: MobileManufactured
- Property subtype: Mobile Home, Manufactured Home
Materials
- Roof: Composition
Condition
- Updated/Remodeled
- New construction: No
- Year built: 1990
Utilities & green energy
- Sewer: Public Sewer
- Water: Public
- Utilities for property: Water Connected
Community & HOA
HOA
- Has HOA: No
Location
- Region: Visalia
Financial & listing details
- Price per square foot: $60/sqft
- Tax assessed value: $4,228,898
- Date on market: 9/17/2026
- Cumulative days on market: 205 days
- Body type: Double Wide
Estimated market value
Not available
Estimated sales range
Not available
Not available
Price history
| Date | Event | Price |
|---|---|---|
| 10/5/2026 | Pending sale | $69,900+16.7%$60/sqft |
Source:  TCMLS #243442 Report a problem | ||
| 10/5/2026 | Price change | $59,900-14.3%$51/sqft |
Source: TCMLS #244483 Report a problem | ||
| 9/17/2026 | Listed for sale | $69,900$60/sqft |
Source: TCMLS #243442 Report a problem | ||
| 9/14/2026 | Pending sale | $69,900$60/sqft |
Source: TCMLS #243442 Report a problem | ||
| 8/12/2026 | Listed for sale | $69,900+20.7%$60/sqft |
Source: TCMLS #243442 Report a problem | ||
| 10/27/2022 | Listing removed | -- |
Source: TCMLS #219263 Report a problem | ||
| 9/24/2022 | Price change | $57,900-3.3%$50/sqft |
Source: TCMLS #219263 Report a problem | ||
| 7/28/2022 | Listed for sale | $59,900+71.6%$51/sqft |
Source: TCMLS #219263 Report a problem | ||
| 2/1/2020 | Sold | $34,900$30/sqft |
Source: TCMLS #202238 Report a problem | ||
Public tax history
| Year | Property taxes | Tax assessment |
|---|---|---|
| 2026 | -- | $4,228,898 +2% |
| 2025 | $45,038 +2.8% | $4,147,786 +1.9% |
| 2024 | $43,797 +3.7% | $4,071,089 +2.8% |
| 2023 | $42,249 +3.1% | $3,958,841 +1.9% |
| 2022 | $40,973 +1.3% | $3,883,754 +2% |
| 2021 | $40,437 +0.8% | $3,807,002 +1.1% |
| 2020 | $40,114 +2.1% | $3,767,349 +0.8% |
| 2019 | $39,289 +2% | $3,737,258 +2.1% |
| 2018 | $38,511 +1.8% | $3,660,370 +2.1% |
| 2017 | $37,823 +1.3% | $3,585,319 +2.1% |
| 2016 | $37,340 | $3,512,037 +1.6% |
| 2015 | $37,340 +3.3% | $3,456,397 +2.1% |
| 2014 | $36,143 | $3,386,226 +0.5% |
| 2013 | -- | $3,368,207 +2.9% |
| 2012 | -- | $3,274,149 +2% |
| 2011 | -- | $3,209,950 +4.6% |
| 2007 | -- | $3,069,520 +2% |
| 2006 | -- | $3,009,333 +2% |
| 2005 | -- | $2,950,326 +2% |
| 2004 | -- | $2,892,476 +1.9% |
| 2003 | -- | $2,839,379 +2% |
| 2002 | -- | $2,783,705 +2% |
| 2001 | -- | $2,729,122 |
Find assessor info on the county website
Monthly payment
Climate risks
Neighborhood: 93291


Similar homes
- $59,5003 bd2 ba1.4k sqft225 N Akers Street #312, Visalia, CA 93291For Sale
 MLS ID #243955, Ed A Morton, Avedian Properties Company. TCMLS
- $99,9003 bd2 ba1.3k sqft415 N Akers Street #117, Visalia, CA 93291For Sale
 MLS ID #241291, Blanca Vargas, Legacy Real Estate Inc. TCMLS
- $102,0002 bd2 ba1.1k sqft415 N Akers Street #1, Visalia, CA 93291For Sale
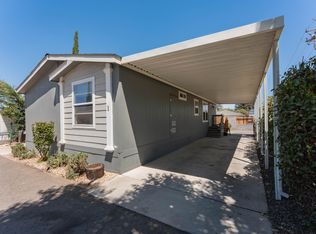 MLS ID #244494, Kassandra Valdez, KW Venture. TCMLS
- $75,0002 bd2 ba1.1k sqft2627 W Midvalley Avenue #141, Visalia, CA 93277For Sale
 MLS ID #243642, Jenny Madrid, Legacy Real Estate Inc. TCMLS
