EXCELLENT 2 BEDROOM/ 2 BATHROOM / 2 CAR GARAGE HOME IN A PERFECT LOCATION CLOSE TO CAMELBACK CORRIDOR AND BILTMORE AREA.GREAT FLOOR PLAN WITH STONE FIREPLACE IN LIVING ROOM, KITCHEN WITH PLENTY OF CABINETS AND COUNTER SPACE AND EAT IN KITCHEN WITH ACCES TO PRIVATE BACK PATIO, MASTER BEDROOM WITH WALK IN CLOSET AND FRENCH DOOR EXIT TO PATIO AND NICE SIZE MASTER BATHROOM.
Pre-foreclosure
Est. $353,000
4226 N 22nd St Unit 13, Phoenix, AZ 85016
2beds
1,102sqft
Townhouse
Built in 1985
-- sqft lot
$353,000 Zestimate®
$320/sqft
$-- HOA
Overview
- 34 days
- 124
- 9
Zillow last checked:
Listing updated:
Source: Zillow Rentals
Facts & features
Interior
Bedrooms & bathrooms
- Bedrooms: 2
- Bathrooms: 2
- Full bathrooms: 2
Heating
- Fireplace
Cooling
- Air Conditioner, Ceiling Fan
Appliances
- Included: Dishwasher, Dryer, Microwave, Range Oven, Refrigerator, Washer
- Laundry: In Unit
Features
- Ceiling Fan(s)
- Has fireplace: Yes
Interior area
- Total interior livable area: 1,102 sqft
Property
Parking
- Parking features: Attached, Garage, Covered
- Has attached garage: Yes
- Details: Contact manager
Features
- Exterior features: , APS Electric, City of Phoenix Water, Eat in Kitchen, Great Room, Pets Allowed - Upon Lessor approval
Details
- Parcel number: 16332079A
Construction
Type & style
- Home type: Townhouse
- Property subtype: Townhouse
Condition
- Year built: 1985
Utilities & green energy
- Utilities for property: Cable Available
Community & HOA
Community
- Deposit fee: $1,995
Location
- Region: Phoenix
Financial & listing details
- Price per square foot: $320/sqft
- Tax assessed value: $381,500
- Annual tax amount: $1,618
- Date on market: 3/22/2025
- Lease term: Contact For Details
Foreclosure details
Estimated market value
$353,000
$325,000 - $381,000
$2,063/mo
Price history
| Date | Event | Price |
|---|---|---|
| 5/21/2025 | Listing removed | $1,945$2/sqft |
Source: Zillow Rentals Report a problem | ||
| 5/3/2025 | Price change | $1,945-2.5%$2/sqft |
Source: Zillow Rentals Report a problem | ||
| 4/22/2025 | Price change | $1,995-4.8%$2/sqft |
Source: Zillow Rentals Report a problem | ||
| 3/23/2025 | Listed for rent | $2,095+27%$2/sqft |
Source: Zillow Rentals Report a problem | ||
| 11/15/2021 | Listing removed | -- |
Source: Zillow Rental Network Premium Report a problem | ||
| 11/4/2021 | Listed for rent | $1,649+22.2%$1/sqft |
Source: Zillow Rental Network Premium Report a problem | ||
| 7/14/2017 | Listing removed | $1,349$1/sqft |
Source: Daniel D Smith & Associates LLC Report a problem | ||
| 7/7/2017 | Listed for rent | $1,349+12.5%$1/sqft |
Source: Daniel D Smith & Associates LLC Report a problem | ||
| 6/27/2015 | Listing removed | $1,199$1/sqft |
Source: Daniel D Smith & Associates LLC Report a problem | ||
| 6/5/2015 | Listed for rent | $1,199+11.5%$1/sqft |
Source: Daniel D Smith & Associates LLC Report a problem | ||
| 8/31/2013 | Sold | $1,075-99.1%$1/sqft |
Source: ARMLS #4982567 Report a problem | ||
| 8/4/2013 | Listed for rent | $1,075$1/sqft |
Source: Daniel D Smith & Associates Report a problem | ||
| 2/14/2013 | Sold | $124,000-10.1%$113/sqft |
Source:  ARMLS #4852634 Report a problem | ||
| 1/31/2013 | Listed for sale | $138,000$125/sqft |
Source: Homepath #4852634 Report a problem | ||
| 12/8/2012 | Listing removed | $138,000$125/sqft |
Source: Homepath #4852634 Report a problem | ||
| 11/22/2012 | Listed for sale | $138,000-21.8%$125/sqft |
Source: Re/Max Prosperity #4852634 Report a problem | ||
| 10/25/2012 | Sold | $176,539+10.4%$160/sqft |
Source: Public Record Report a problem | ||
| 12/7/2004 | Sold | $159,900$145/sqft |
Source: ARMLS #2214884 Report a problem | ||
Public tax history
| Year | Property taxes | Tax assessment |
|---|---|---|
| 2025 | $1,618 +4.9% | $38,150 +4.6% |
| 2024 | $1,542 +2.7% | $36,470 +223.8% |
| 2023 | $1,501 +3.1% | $11,263 -45.2% |
| 2022 | $1,456 +0.7% | $20,550 +2.4% |
| 2021 | $1,446 +2.2% | $20,070 +0% |
| 2020 | $1,414 +2.5% | $20,060 +4% |
| 2019 | $1,379 | $19,280 -3.1% |
| 2018 | $1,379 +5% | $19,900 +13.1% |
| 2017 | $1,314 +11.5% | $17,600 +17.9% |
| 2016 | $1,179 +7.9% | $14,930 +33.7% |
| 2015 | $1,093 | $11,170 +49.7% |
| 2014 | -- | $7,460 +13% |
| 2013 | -- | $6,600 -27.5% |
| 2012 | -- | $9,100 -31.1% |
| 2011 | -- | $13,200 -20.2% |
| 2010 | -- | $16,550 -13.4% |
| 2009 | -- | $19,100 -12.4% |
| 2008 | -- | $21,800 +30.1% |
| 2007 | -- | $16,750 +40.2% |
| 2006 | -- | $11,950 |
| 2005 | -- | $11,950 +24.5% |
| 2004 | -- | $9,600 |
| 2003 | -- | $9,600 +17.1% |
| 2002 | -- | $8,200 |
Find assessor info on the county website
Monthly payment
Climate risks
Neighborhood: Camelback East
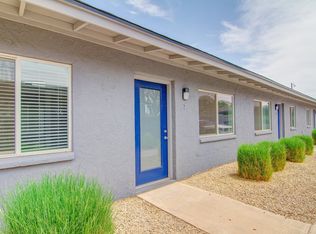


Similar homes
- $355,0002 bd2 ba1.2k sqft4533 N 22ND Street #208, Phoenix, AZ 85016For Sale
 MLS ID #7081025, Marissa Kline, Compass. ARMLS
- $374,9002 bd3 ba1.2k sqft4644 N 22ND Street #2117, Phoenix, AZ 85016For Sale
 MLS ID #7066796, Mahmut Ozdiker, HomeSmart. ARMLS
- $335,0002 bd2 ba1.5k sqft2229 E CATALINA Drive, Phoenix, AZ 85016For Sale
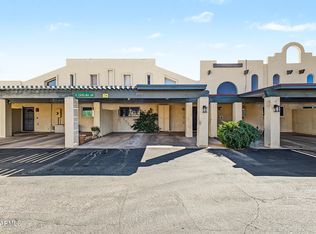 MLS ID #7094065, Chase A Dubs, Real Broker. ARMLS
- $420,0002 bd2 ba1.1k sqft4144 N 21ST Street #8, Phoenix, AZ 85016For Sale
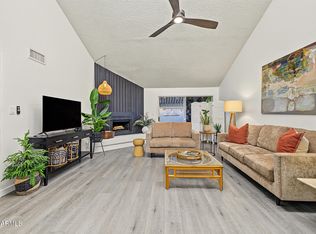 MLS ID #7090341, Adam Bailey, RETSY. ARMLS
