1,112.00 sq. ft. Townhouse for sale in Centerpoint Region, Oxnard. Priced at $265,000.00 Brokered And Advertised By: Superior Realty Group Listing Agent: Superior Realty Group
Sold for $425,000
$425,000
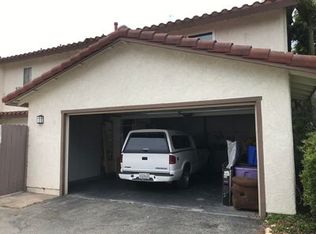
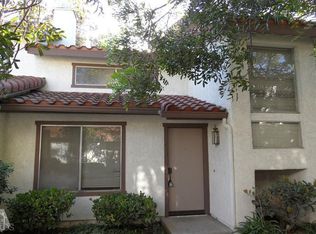
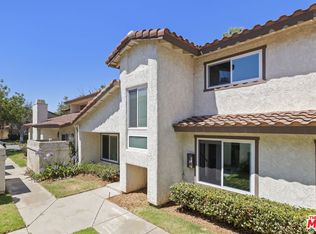
423 Percy St, Oxnard, CA 93033
2beds
2baths
1,112sqft
Condo
Built in 1981
-- sqft lot
$424,900 Zestimate®
$382/sqft
$2,731 Estimated rent
Home value
$424,900
$391,000 - $463,000
$2,731/mo
Zestimate® history
Owner options
List your home for rent
$2,731/mo
Rent Zestimate®
Find your next renter with Zillow Rental Manager. Plus, with online applications, you can quickly screen prospective tenants – for free.
$2,731/mo
Rent Zestimate®
Refinance and save
$2,912/mo
Est. payment
Refinancing to a lower rate could help reduce your monthly payments and save thousands over the life of the loan.
$2,912/mo
Est. payment
Explore your selling options
Work with a Zillow partner agent
Leverage their expertise and Zillow's premium Showcase listings to get your home seen by more buyers.
Get startedList with your own agent
Get your home in front of millions of buyers by listing it on Zillow.
Learn how to do itSell it yourself
Take full control of how buyers see your home on Zillow by listing For Sale by Owner (FSBO).
List your homeWhat's special
Facts & features
Interior
Bedrooms & bathrooms
- Bedrooms: 2
- Bathrooms: 2
Heating
- Other, Gas
Appliances
- Included: Dishwasher
Features
- Flooring: Tile
- Has fireplace: Yes
Interior area
- Total interior livable area: 1,112 sqft
Property
Parking
- Total spaces: 2
- Parking features: Garage - Detached
Features
- Exterior features: Stucco
Lot
- Size: 984 sqft
Details
- Parcel number: 2220361085
Construction
Type & style
- Home type: Condo
Materials
- Roof: Tile
Condition
- Year built: 1981
Community & neighborhood
Location
- Region: Oxnard
HOA & financial
HOA
- Has HOA: Yes
- HOA fee: $280 monthly
Price history
| Date | Event | Price |
|---|---|---|
| 5/5/2026 | Sold | $425,000+66.7%$382/sqft |
Source: Public Record Report a problem | ||
| 7/2/2015 | Sold | $255,000-3.8%$229/sqft |
Source: Public Record Report a problem | ||
| 6/20/2015 | Pending sale | $265,000$238/sqft |
Source: Superior Realty Group Report a problem | ||
| 6/4/2015 | Price change | $265,000+0%$238/sqft |
Source: Superior Realty Group Report a problem | ||
| 5/9/2015 | Price change | $264,900+1.5%$238/sqft |
Source: Superior Realty Group Report a problem | ||
| 3/23/2015 | Price change | $261,000-1.5%$235/sqft |
Source: Superior Realty Group #215001631 Report a problem | ||
| 2/22/2015 | Price change | $264,900-1.9%$238/sqft |
Source: Superior Realty Group Report a problem | ||
| 2/7/2015 | Listed for sale | $270,000+48.4%$243/sqft |
Source: Superior Realty Group #215001631 Report a problem | ||
| 9/29/2008 | Sold | $182,000+5.9%$164/sqft |
Source: Public Record Report a problem | ||
| 8/19/2008 | Listed for sale | $171,900-23.6%$155/sqft |
Source: foreclosure.com Report a problem | ||
| 5/31/2008 | Listing removed | $224,900$202/sqft |
Source: Prudential California #80008367 Report a problem | ||
| 4/28/2008 | Listed for sale | $224,900-20.2%$202/sqft |
Source: Prudential California #80008367 Report a problem | ||
| 3/24/2008 | Sold | $281,700-29%$253/sqft |
Source: Public Record Report a problem | ||
| 6/28/2005 | Sold | $397,000+309.3%$357/sqft |
Source: Public Record Report a problem | ||
| 12/23/1997 | Sold | $97,000$87/sqft |
Source: Public Record Report a problem | ||
Public tax history
| Year | Property taxes | Tax assessment |
|---|---|---|
| 2025 | $3,680 +8.1% | $301,860 +2% |
| 2024 | $3,404 | $295,942 +2% |
| 2023 | $3,404 +2.1% | $290,140 +2% |
| 2022 | $3,334 -1.2% | $284,451 +2% |
| 2021 | $3,375 -1.8% | $278,874 +1% |
| 2020 | $3,437 +3.1% | $276,017 +2% |
| 2019 | $3,335 +3.8% | $270,606 +2% |
| 2018 | $3,212 +3.3% | $265,301 +2% |
| 2017 | $3,108 +5% | $260,100 +2% |
| 2016 | $2,960 +26.4% | $255,000 +30.8% |
| 2015 | $2,342 +17.6% | $194,899 +18.1% |
| 2014 | $1,991 | $165,000 +5.8% |
| 2013 | -- | $156,000 +16.4% |
| 2012 | -- | $134,000 -13% |
| 2011 | -- | $154,000 -15.3% |
| 2009 | -- | $181,900 -56% |
| 2007 | -- | $413,038 +2% |
| 2006 | -- | $404,940 +264.4% |
| 2005 | -- | $111,110 +3.9% |
| 2003 | -- | $106,937 +2% |
| 2002 | -- | $104,841 +2% |
| 2001 | $1,174 +1.5% | $102,786 +2% |
| 2000 | $1,156 | $100,771 |
Find assessor info on the county website
Neighborhood: Pleasant Valley Estates
Nearby schools
GreatSchools rating
- 4/10Julien Hathaway Elementary SchoolGrades: K-5Distance: 0.2 mi
- 3/10Charles Blackstock Junior High SchoolGrades: 6-8Distance: 0.3 mi
- 4/10Hueneme High SchoolGrades: 9-12Distance: 0.4 mi
Get a cash offer in 3 minutes
Find out how much your home could sell for in as little as 3 minutes with a no-obligation cash offer.
Estimated market value
$424,900
Get a cash offer in 3 minutes
Find out how much your home could sell for in as little as 3 minutes with a no-obligation cash offer.
Estimated market value
$424,900
Nearby cities
Nearby neighborhoods
Nearby zip codes
Other Oxnard Topics
