Land Value Opportunity Steps to Horner Park; Rare oversized lot, approx. 37 x 125, in a prime Irving Park location just steps from Horner Park. The real value is in the land. This RS-3 zoned site is ideal for a tear-down and new construction, with room to build a nice size home. The existing Nonconforming multi-family building offers three levels of living space, separate electric meters (3), and two gas meters. Build new on one of the area's wider lots and enjoy the park, river paths, dining, shopping, and transit all close by. Sold as-is, where-is with any and all faults. Buyer to verify zoning, buildable square footage, and all information.
Pending
$559,900
4251 N Whipple St, Chicago, IL 60618
3beds
--sqft
Multi Family
Built in 1904
-- sqft lot
$-- Zestimate®
$--/sqft
$-- HOA
What's special
- 20 days
- 274
- 6
Zillow last checked:
Listing updated:
Listed by:
Nicholas Hansen 708-214-6425,
Home One Realty
Source: MRED as distributed by MLS GRID,MLS#: 12785565
Facts & features
Interior
Bedrooms & bathrooms
- Bedrooms: 3
- Bathrooms: 2
- Full bathrooms: 3
Heating
- Natural Gas, Forced Air, Space Heater
Features
- Basement: Partially Finished,Full,Walk-Out Access
Property
Parking
- Total spaces: 2
- Parking features: Yes, Garage Owned, Detached, Garage
- Garage spaces: 2
Lot
- Size: 4,625 Square Feet
- Dimensions: 37x125
Details
- Parcel number: 13133110030000
- Special conditions: None
Construction
Type & style
- Home type: MultiFamily
- Property subtype: Multi Family
Materials
- Frame
Condition
- New construction: No
- Year built: 1904
Utilities & green energy
- Sewer: Public Sewer
- Water: Lake Michigan
Community & HOA
Location
- Region: Chicago
Financial & listing details
- Tax assessed value: $470,000
- Annual tax amount: $8,688
- Date on market: 10/15/2026
- Ownership: Fee Simple
Estimated market value
Not available
Estimated sales range
Not available
$2,687/mo
Price history
| Date | Event | Price |
|---|---|---|
| 10/16/2026 | Pending sale | $559,900 |
Source:  MRED as distributed by MLS GRID #12785565 Report a problem | ||
| 10/15/2026 | Listed for sale | $559,900+43.6% |
Source: MRED as distributed by MLS GRID #12785565 Report a problem | ||
| 7/16/2026 | Sold | $390,000 |
Source: Public Record Report a problem | ||
Public tax history
| Year | Property taxes | Tax assessment |
|---|---|---|
| 2024 | $3,176 -63.4% | $47,000 |
| 2023 | $8,688 +157.3% | $47,000 |
| 2022 | $3,377 +5.1% | $47,000 |
| 2021 | $3,213 -3.1% | $47,000 +42.6% |
| 2020 | $3,317 +0.3% | $32,951 -10% |
| 2019 | $3,306 +1.5% | $36,613 |
| 2018 | $3,256 -6.6% | $36,613 +13.7% |
| 2017 | $3,487 -46.1% | $32,204 |
| 2016 | $6,472 +74.5% | $32,204 |
| 2015 | $3,709 +4.7% | $32,204 +33.3% |
| 2014 | $3,541 -8.3% | $24,154 -8.6% |
| 2013 | $3,863 -7.3% | $26,419 |
| 2012 | $4,165 +10.6% | $26,419 -21.7% |
| 2011 | $3,764 +18.6% | $33,724 |
| 2010 | $3,174 +10.6% | $33,724 |
| 2009 | $2,870 +2.8% | $33,724 -7.3% |
| 2008 | $2,792 +3.2% | $36,371 |
| 2007 | $2,705 -12.7% | $36,371 |
| 2006 | $3,101 -22.8% | $36,371 +47.9% |
| 2005 | $4,019 +1% | $24,594 |
| 2004 | $3,978 +2.2% | $24,594 |
| 2003 | $3,892 +24% | $24,594 +40.8% |
| 2002 | $3,138 +17.3% | $17,467 |
| 2001 | $2,674 +4.4% | $17,467 |
| 2000 | $2,560 +17.5% | $17,467 +31.1% |
| 1999 | $2,178 | $13,328 |
Find assessor info on the county website
Monthly payment
Est. payment
Payment breakdown
Explore the cost of this home by adjusting the details. Changes won't be saved.Climate risks
Neighborhood: Irving Park
Nearby schools

Similar homes
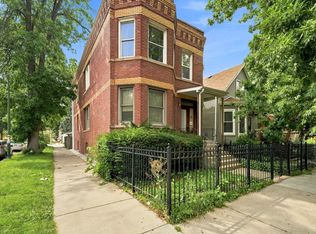
- $649,9005 bd3 ba-- sqft4239 N Albany Ave, Chicago, IL 60618Active
 MLS ID #12797507, Martha Lozano, RE/MAX City. MRED as distributed by MLS GRID
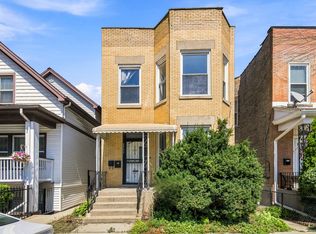
- $599,5005 bd3 ba-- sqft3067 N Central Park Ave, Chicago, IL 60618Active
 MLS ID #12793770, Jason Raider, Raider Realty LLC.. MRED as distributed by MLS GRID
- $630,0005 bd3 ba-- sqft4100 N Kimball Ave, Chicago, IL 60618Active
 MLS ID #12728422, Aleya Abdulawal, Coldwell Banker Realty. MRED as distributed by MLS GRID
- $619,9984 bd2 ba-- sqft2959 N Elston Ave, Chicago, IL 60618Active
 MLS ID #12720299, Andrew Wendt, Compass. MRED as distributed by MLS GRID
