A diamond in the rough located on a very desirable street in Little Gables.
Very large home on a tree lined street.
Property needs rehab but is in functional condition. Has new roof, very large master with bathroom and walk in closet, very spacious home. Can easily be converted into a 4 bedroom.
Selling at $522 per square foot, the average sale in Little Gables is $670 to $816 per square foot.
First pic is obvious potential look. As is, cash deal......
Thank You
For sale by owner
Price cut: $500 (11/6)
$949,500
4280 SW 13th St, Miami, FL 33134
3beds
1,820sqft
SingleFamily
Built in 1950
5,800 Square Feet Lot
$-- Zestimate®
$522/sqft
$-- HOA
What's special
New roofVery large homeTree lined streetVery spacious home
What the owner loves about this home
location, large home, plenty of square footage
- 40 days
- 796
- 22
Listed by:
Property Owner (786) 487-6578
Facts & features
Interior
Bedrooms & bathrooms
- Bedrooms: 3
- Bathrooms: 2
- Full bathrooms: 2
Interior area
- Total interior livable area: 1,820 sqft
Property
Features
- Exterior features: Other
Lot
- Size: 5,800 Square Feet
Details
- Parcel number: 3041080280750
Construction
Type & style
- Home type: SingleFamily
Materials
- concrete
- Roof: Other
Condition
- New construction: No
- Year built: 1950
Community & HOA
Location
- Region: Miami
Financial & listing details
- Price per square foot: $522/sqft
- Tax assessed value: $676,994
- Annual tax amount: $10,428
- Date on market: 10/10/2026
Estimated market value
Not available
Estimated sales range
Not available
$5,329/mo
Price history
| Date | Event | Price |
|---|---|---|
| 11/6/2026 | Price change | $949,500-0.1%$522/sqft |
Source: Owner Report a problem | ||
| 10/10/2026 | Listed for sale | $950,000$522/sqft |
Source: Owner Report a problem | ||
| 9/30/2024 | Listing removed | -- |
Source: Owner Report a problem | ||
| 7/2/2024 | Listed for sale | $950,000$522/sqft |
Source: Owner Report a problem | ||
Public tax history
| Year | Property taxes | Tax assessment |
|---|---|---|
| 2025 | $10,428 +9.2% | $506,594 +10% |
| 2024 | $9,549 +12.1% | $460,540 +10% |
| 2023 | $8,521 +13.7% | $418,673 +10% |
| 2022 | $7,494 +13.6% | $380,612 +10% |
| 2021 | $6,596 -2.3% | $346,011 -2.2% |
| 2020 | $6,749 +210% | $353,671 +118.3% |
| 2019 | $2,177 +6.4% | $162,006 +1.9% |
| 2018 | $2,046 | $158,986 +2.1% |
| 2017 | $2,046 +1.1% | $155,716 +2.1% |
| 2016 | $2,023 +0.6% | $152,514 +0.7% |
| 2015 | $2,012 -20.5% | $151,454 +0.8% |
| 2014 | $2,531 +4.3% | $150,252 +1.5% |
| 2013 | $2,427 | $148,032 +1.7% |
| 2012 | $2,427 +2.3% | $145,558 +3% |
| 2011 | $2,373 -4.7% | $141,319 +1.5% |
| 2010 | $2,490 +39.3% | $139,231 +2.7% |
| 2009 | $1,787 -8.8% | $135,571 +140% |
| 2007 | $1,960 -12.8% | $56,492 |
| 2006 | $2,247 | -- |
| 2005 | $2,247 +2.1% | -- |
| 2004 | $2,201 +7.1% | -- |
| 2003 | $2,054 +3.8% | -- |
| 2002 | $1,978 | -- |
| 2001 | $1,978 | -- |
Find assessor info on the county website
Monthly payment
Est. payment
Payment breakdown
Explore the cost of this home by adjusting the details. Changes won't be saved.Climate risks
Neighborhood: 33134
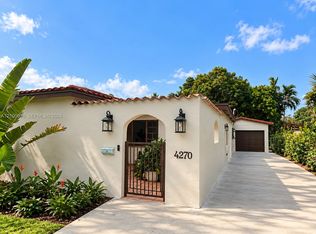

Similar homes
- $925,0003 bd2 ba1.7k sqftLe Jeune Villas, Miami, FL 33134For Sale
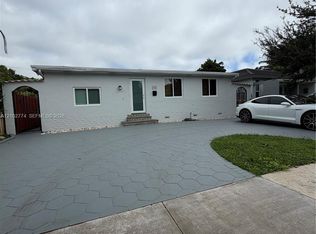
 MLS ID #A12102774, Alberto Calil, Esquire Real Estate Serv.. MIAMI
- $974,5005 bd2 ba1.6k sqftCamner Gables, Miami, FL 33134For Sale
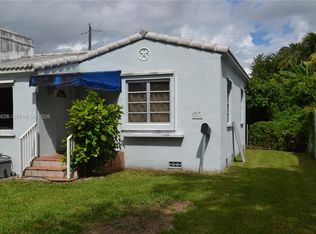 MLS ID #A12114626, Alexander Alonso, Florida Realty of Miami Corp. MIAMI
- $795,0003 bd2 ba1.4k sqftWest Flagler Center Le Je, Miami, FL 33134For Sale
 MLS ID #A12125239, Anthony Auletta, Florida Realty of Miami Corp. MIAMI
- $1,080,0003 bd2 ba1.5k sqftCamner Gables 1st Addn Rev, Miami, FL 33134For Sale
 MLS ID #A12057015, Aida M. Ortiz PA, The Keyes Company. MIAMI
- $885,0003 bd2 ba1.7k sqftCoral Gables Flagler Stre, Coral Gables, FL 33134For SaleMLS ID #A12121538, Kevin Alleyne, Keller Williams Realty Miami Beach. MIAMI
- $990,0005 bd3 ba1.9k sqftTierra Alta, Miami, FL 33134For SaleMLS ID #A12120477, Jose Castillo Jr., JFA Realty Co. MIAMI
- $959,0004 bd2 ba1.5k sqftCoral Gables Flagler Stre, Coral Gables, FL 33134For SaleMLS ID #A12080444, Claribel Cangas, United Real Estate Miami. MIAMI
- $995,0003 bd2 ba1.3k sqftWelbon, Coral Gables, FL 33134For SaleMLS ID #A12060355, Stefan Segall, Compass Florida, LLC. MIAMI
- $745,0003 bd2 ba1.3k sqftFlagler Court Heights, Miami, FL 33134For SaleMLS ID #A12124863, Karen Fernandez, Floridian First Realty Corp. MIAMI
- $1,400,0004 bd2 ba1.7k sqftLe Jeune Villas, Miami, FL 33134For SaleMLS ID #A12123464, Maria Lopez Pulido, Compass Florida, LLC. MIAMI
- $910,0003 bd2 ba1.4k sqftWest Flagler Center, Miami, FL 33134For SaleMLS ID #A12071985, Barbara Serrano Negron, Florida Capital Realty. MIAMI
- $898,0003 bd1 ba1.1k sqftCoral Gables Flagler Stre, Coral Gables, FL 33134For SaleMLS ID #A12118625, Alejandro Herrera, Avanti Way Realty LLC. MIAMI
- $1,325,0003 bd2 ba1.9k sqftSunny Grove, Miami, FL 33134For SaleMLS ID #A12100038, Asmer Monterrey, Monterrey Realty Group, Inc.. MIAMI
- $1,150,0003 bd2 ba1.4k sqftCoral Gables Granada Sec, Coral Gables, FL 33134For SaleMLS ID #A12117725, Jesus Gonzalez, Compass Florida, LLC. MIAMI
- $1,150,0003 bd2 ba1k sqft1st Addn Granada Place, Coral Gables, FL 33134For SaleMLS ID #A12122442, Mike DeVito, RE/MAX United Realty. MIAMI
- $929,0004 bd3 ba2k sqftHazelton Park, Miami, FL 33134For SaleMLS ID #A11985919, Claudia Del Toro, Cervera Real Estate Inc.. MIAMI
- $1,275,0003 bd3 ba1.3k sqftCoral Gables Sec B, Coral Gables, FL 33134For SaleMLS ID #A12122478, Jenilyn Martinez, Compass Florida, LLC. MIAMI
- $920,0003 bd3 ba1.7k sqftAmnd Miami Suburban Acres, Miami, FL 33145For SaleMLS ID #A12122211, Gina Vignolo, Yaffe International Realty. MIAMI
- $948,0002 bd2 ba1k sqftTamiami Place Plan 1, Coral Gables, FL 33134For SaleMLS ID #A12023760, Belinda Sime, Sime Realty Corporation. MIAMI
- $1,050,0003 bd2 ba1.4k sqftCoral Gables Flagler St S, Coral Gables, FL 33134For SaleMLS ID #A11546810, Julissa Garcia, Unique Investment Realty, Inc. MIAMI
