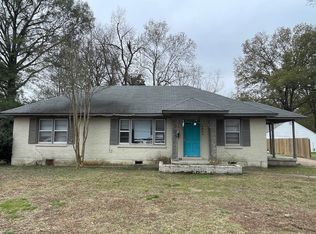
Welcome to this charming 3-bedroom, 1-bath home offering 987 square feet of living space! Featuring a functional floor plan with comfortable living areas, this property offers plenty of possibilities to make it your own. Whether you're looking for a place to call home or an opportunity to add to your investment portfolio, this property offers great potential. Schedule your showing today! One or more photos may have been virtually staged.
For sale
$144,900
4286 Fredericks Ave, Memphis, TN 38111
3beds
957sqft
Single Family Residence
Built in 1955
6,534 Square Feet Lot
$139,200 Zestimate®
$151/sqft
$-- HOA
What's special
Functional floor plan
- 14 days
- 60
- 3
Likely to sell faster than
Zillow last checked:
Listing updated:
Listed by:
Adam Woodring,
Mainstay Brokerage, LLC 800-583-2914
Source: MAAR,MLS#: 10233035
Facts & features
Interior
Bedrooms & bathrooms
- Bedrooms: 3
- Bathrooms: 1
- Full bathrooms: 1
Primary bedroom
- Dimensions: 0 x 0
Dining room
- Dimensions: 0 x 0
Kitchen
- Features: Eat-in Kitchen
Living room
- Dimensions: 0 x 0
Den
- Dimensions: 0 x 0
Heating
- Central
Cooling
- Central Air
Features
- Other (See Remarks), Square Feet Source: AutoFill (MAARdata) or Public Records (Cnty Assessor Site)
- Has fireplace: No
Interior area
- Total interior livable area: 957 sqft
Property
Parking
- Parking features: Driveway/Pad
- Has uncovered spaces: Yes
Features
- Stories: 1
- Exterior features: Other (See REMARKS)
- Pool features: None
Lot
- Size: 6,534 Square Feet
- Dimensions: 60 x 114
- Features: Other (See Remarks)
Details
- Parcel number: 058144 00020
Construction
Type & style
- Home type: SingleFamily
- Architectural style: Ranch
- Property subtype: Single Family Residence
Materials
- Brick Veneer
Condition
- New construction: No
- Year built: 1955
Community & HOA
Community
- Subdivision: Park Acres Addition
Location
- Region: Memphis
Financial & listing details
- Price per square foot: $151/sqft
- Tax assessed value: $99,900
- Annual tax amount: $1,317
- Price range: $144.9K - $144.9K
- Date on market: 10/22/2026
- Cumulative days on market: 15 days
Estimated market value
$139,200
$132,000 - $146,000
$1,141/mo
Price history
| Date | Event | Price |
|---|---|---|
| 10/22/2026 | Listed for sale | $144,900+1211.2%$151/sqft |
Source:  MAAR #10233035 Report a problem | ||
| 9/15/2025 | Listing removed | $1,020$1/sqft |
Source: Zillow Rentals Report a problem | ||
| 9/13/2025 | Listed for rent | $1,020$1/sqft |
Source: Zillow Rentals Report a problem | ||
| 9/13/2024 | Listing removed | $1,020$1/sqft |
Source: Zillow Rentals Report a problem | ||
| 7/20/2024 | Price change | $1,020-6.4%$1/sqft |
Source: Zillow Rentals Report a problem | ||
| 7/12/2024 | Price change | $1,090-4%$1/sqft |
Source: Zillow Rentals Report a problem | ||
| 6/29/2024 | Price change | $1,135-0.9%$1/sqft |
Source: Zillow Rentals Report a problem | ||
| 6/22/2024 | Price change | $1,145-3.4%$1/sqft |
Source: Zillow Rentals Report a problem | ||
| 6/13/2024 | Price change | $1,185-0.8%$1/sqft |
Source: Zillow Rentals Report a problem | ||
| 6/4/2024 | Price change | $1,195-7.4%$1/sqft |
Source: Zillow Rentals Report a problem | ||
| 5/29/2024 | Price change | $1,290-2.3%$1/sqft |
Source: Zillow Rentals Report a problem | ||
| 5/16/2024 | Price change | $1,320-1.5%$1/sqft |
Source: Zillow Rentals Report a problem | ||
| 5/8/2024 | Listed for rent | $1,340+18.1%$1/sqft |
Source: Zillow Rentals Report a problem | ||
| 4/6/2023 | Listing removed | -- |
Source: Zillow Rentals Report a problem | ||
| 4/3/2023 | Price change | $1,135-8.1%$1/sqft |
Source: Zillow Rentals Report a problem | ||
| 3/24/2023 | Price change | $1,235-0.8%$1/sqft |
Source: Zillow Rentals Report a problem | ||
| 3/17/2023 | Price change | $1,245-6.4%$1/sqft |
Source: Zillow Rentals Report a problem | ||
| 2/23/2023 | Price change | $1,330-1.1%$1/sqft |
Source: Zillow Rentals Report a problem | ||
| 2/13/2023 | Listed for rent | $1,345$1/sqft |
Source: Zillow Rentals Report a problem | ||
| 10/1/2009 | Sold | $11,051$12/sqft |
Source: Public Record Report a problem | ||
Public tax history
| Year | Property taxes | Tax assessment |
|---|---|---|
| 2025 | $1,316 +32.2% | $24,975 +65.1% |
| 2024 | $996 +8.1% | $15,125 |
| 2023 | $921 | $15,125 |
| 2022 | -- | $15,125 |
| 2021 | -- | $15,125 +19.3% |
| 2020 | $405 | $12,675 |
| 2019 | $405 -21.1% | $12,675 |
| 2018 | $513 -45.1% | $12,675 |
| 2017 | $936 +101.2% | $12,675 -7.3% |
| 2016 | $465 +4.1% | $13,675 |
| 2014 | $446 | $13,675 |
| 2013 | -- | $13,675 -2.3% |
| 2012 | -- | $14,000 |
| 2011 | -- | $14,000 -20.9% |
| 2010 | -- | $17,700 |
| 2009 | -- | $17,700 +5.7% |
| 2008 | -- | $16,750 |
| 2007 | -- | $16,750 |
| 2006 | -- | $16,750 |
| 2005 | -- | $16,750 +1.8% |
| 2004 | -- | $16,450 |
| 2003 | -- | $16,450 |
| 2002 | -- | $16,450 |
| 2001 | -- | $16,450 +18.6% |
| 2000 | -- | $13,875 |
Find assessor info on the county website
Monthly payment
Est. payment
Payment breakdown
Explore the cost of this home by adjusting the details. Changes won't be saved.Climate risks
Neighborhood: Colonial-Yorkshire


Similar homes
- $130,0003 bd2 ba1.2k sqft3904 Kimball Ave, Memphis, TN 38111For Sale
 MLS ID #10222182, Alex Evans, Reedy & Company, REALTORS. MAAR
- $134,9002 bd1 ba950 sqft3278 Hendricks Ave, Memphis, TN 38111For Sale
 MLS ID #10230024, Dean Harris, CrestCore Realty MphsBrokerage. MAAR
- $130,0003 bd1 ba1.3k sqft3863 Spottswood Ave, Memphis, TN 38111For Sale
 MLS ID #10227042, August P Pacente, Revid Property Management, LLC. MAAR
- $164,9003 bd1 ba1.2k sqft4643 Flamingo Rd, Memphis, TN 38117For Sale
 MLS ID #10231843, Lowell Brister, Leco Realty, Inc.. MAAR
