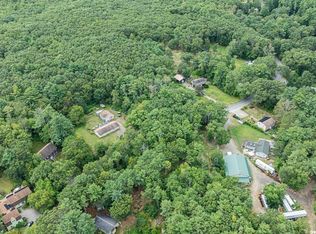
6 Acres! Zoned R2 - Many uses to include Single Family, (Accessory Apartment Dwelling with Special Permit) Agricultural, Raising or Keeping of Livestock, ** Horses and Poultry ** and much more. Please do not walk land without List Agent. Buyers and Buyers Agent to do their Due Diligence.
Lot/land
Price cut: $25K (6/2)
$260,000
44 Seabrook Rd, Salisbury, MA 01952
--beds
0baths
6Acres
Residential
Built in ----
6 Acres Lot
$-- Zestimate®
$--/sqft
$-- HOA
What's special
- 676 days |
- 245 |
- 18 |
Zillow last checked:
Listing updated:
Listed by:
The North Shore Realty Group 978-710-9388,
eXp Realty LLC 888-854-7493
Source: MLS PIN,MLS#: 73293597
Facts & features
Interior
Bedrooms & bathrooms
- Bathrooms: 0
Features
- Has basement: No
Property
Features
- Frontage length: 207.00
Lot
- Size: 6 Acres
- Features: Sloped, Wooded, Gentle Sloping
Details
- Parcel number: 2146406
- Zoning: R2
Utilities & green energy
- Electric: At Street
- Gas: None
- Sewer: Private Sewer, Other
- Water: Private, Other
Community & HOA
Community
- Features: Public Transportation, Shopping, Park, Walk/Jog Trails, Laundromat, Bike Path, Conservation Area, Highway Access, House of Worship, Public School
HOA
- Has HOA: No
Location
- Region: Salisbury
Financial & listing details
- Tax assessed value: $225,200
- Annual tax amount: $2,353
- Date on market: 9/23/2024
Estimated market value
Not available
Estimated sales range
Not available
$2,758/mo
Price history
| Date | Event | Price |
|---|---|---|
| 6/2/2026 | Price change | $260,000-8.8% |
Source: MLS PIN #73293597 Report a problem | ||
| 8/12/2025 | Price change | $285,000-1.7% |
Source: MLS PIN #73293597 Report a problem | ||
| 9/23/2024 | Listed for sale | $290,000-22.1% |
Source: MLS PIN #73293597 Report a problem | ||
| 8/27/2024 | Listing removed | $372,500 |
Source: MLS PIN #73205540 Report a problem | ||
| 2/26/2024 | Listed for sale | $372,500+119.1% |
Source: MLS PIN #73205540 Report a problem | ||
| 6/3/2022 | Listing removed | -- |
Source: MLS PIN #72651058 Report a problem | ||
| 12/27/2021 | Sold | $170,000-38.2% |
Source: MLS PIN #72802001 Report a problem | ||
| 10/15/2021 | Contingent | $275,000 |
Source: MLS PIN #72802001 Report a problem | ||
| 3/22/2021 | Listed for sale | $275,000 |
Source: MLS PIN #72802001 Report a problem | ||
| 3/1/2021 | Listing removed | $275,000 |
Source: MLS PIN #72651058 Report a problem | ||
| 1/6/2021 | Listed for sale | $275,000 |
Source: MLS PIN #72651058 Report a problem | ||
| 10/21/2020 | Listing removed | $275,000 |
Source: The North Shore Realty Group #72651058 Report a problem | ||
| 10/7/2020 | Pending sale | $275,000 |
Source: The North Shore Realty Group #72651058 Report a problem | ||
| 5/4/2020 | Listed for sale | $275,000+150% |
Source: The North Shore Realty Group #72651058 Report a problem | ||
| 11/19/2016 | Listing removed | $110,000 |
Source: Coldwell Banker Residential Brokerage - Newburyport #71934037 Report a problem | ||
| 5/20/2016 | Listed for sale | $110,000 |
Source: Coldwell Banker Residential Brokerage - Newburyport #71934037 Report a problem | ||
Public tax history
| Year | Property taxes | Tax assessment |
|---|---|---|
| 2025 | $2,270 -3.5% | $225,200 |
| 2024 | $2,353 -3.2% | $225,200 |
| 2023 | $2,432 | $225,200 |
| 2022 | $2,432 +2.8% | $225,200 +7.2% |
| 2021 | $2,365 -1.7% | $210,000 |
| 2020 | $2,407 +2.8% | $210,000 +6.3% |
| 2019 | $2,342 +0.6% | $197,500 |
| 2018 | $2,327 +11.1% | $197,500 +12.4% |
| 2017 | $2,094 +6.1% | $175,700 +3.9% |
| 2016 | $1,973 -0.7% | $169,100 |
| 2015 | $1,987 +3.7% | $169,100 +4% |
| 2014 | $1,917 +2.4% | $162,600 |
| 2013 | $1,872 -1.6% | $162,600 -6.3% |
| 2012 | $1,903 +3.2% | $173,500 |
| 2011 | $1,844 +3.9% | $173,500 -3.6% |
| 2010 | $1,775 -1.9% | $180,000 -8.9% |
| 2009 | $1,809 +18.5% | $197,500 +9.5% |
| 2008 | $1,526 +3.4% | $180,400 |
| 2007 | $1,476 +1.6% | $180,400 +1.7% |
| 2006 | $1,453 -5.9% | $177,400 +11.9% |
| 2005 | $1,544 +10.2% | $158,500 +15% |
| 2004 | $1,401 +16.3% | $137,800 +22.2% |
| 2003 | $1,205 -6.2% | $112,800 +13.5% |
| 2002 | $1,284 +51.4% | $99,400 +51.3% |
| 1997 | $848 | $65,700 |
Find assessor info on the county website
Monthly payment
Climate risks
Neighborhood: 01952
Nearby schools
GreatSchools rating
- 6/10Salisbury Elementary SchoolGrades: PK-6Distance: 0.7 mi
- 7/10Triton Regional Middle SchoolGrades: 7-8Distance: 8.4 mi
- 6/10Triton Regional High SchoolGrades: 9-12Distance: 8.4 mi
Schools provided by the listing agent
- Elementary: Salisbury Elem
- Middle: Triton Middle
- High: Triton High
Source: MLS PIN. This data may not be complete. We recommend contacting the local school district to confirm school assignments for this home.
- $502,3003 bd2 ba1.2k sqft46 Seabrook Rd, Salisbury, MA 01952Off Market
- $467,700-- bd-- ba-- sqft46 Seabrook Rd, Salisbury, MA 01952Off Market
- $773,300-- bd2 ba1.9k sqft40 Seabrook Rd, Salisbury, MA 01952Off Market
- $799,3003 bd2 ba2.2k sqft42 Seabrook Rd, Salisbury, MA 01952Off Market
- $875,0003 bd2 ba2.7k sqft38 Seabrook Rd, Salisbury, MA 01952Off Market
- $747,0003 bd2 ba2.4k sqft32 Seabrook Rd, Salisbury, MA 01952Off Market
- $820,7003 bd4 ba2.5k sqft36 Seabrook Rd, Salisbury, MA 01952Off Market
- $680,6003 bd2 ba1.7k sqft34 Seabrook Rd, Salisbury, MA 01952Off Market
A local agent can set up tours, give advice and negotiate with sellers.
A local lender can help you make sure your offer is ready when you are.
Similar homes
- $225,0003.78 Acres64 Seabrook Rd, Salisbury, MA 01952Lot/Land
 MLS ID #73524763, Michelle Draper, Keller Williams Realty Evolution. MLS PIN
 - $350,0001.238 Acres6 Palis Dr, Salisbury, MA 01952Lot/Land
 MLS ID #73497057, AJ Pappas, eXp Realty LLC. MLS PIN
 - $275,0007,072 Square Feet14-14B Maple St, Amesbury, MA 01913Lot/Land
 MLS ID #73523252, Mae Wojcicki, Lamacchia Realty, Inc.. MLS PIN
 - $329,0002.3 Acres46 Gile St, Haverhill, MA 01830Lot/Land
 MLS ID #73497828, Andrew Kaknes, NextHome Tradition. MLS PIN
 - $349,0003.245 Acres13 Whipple Woods Rd, Gloucester, MA 01930Lot/LandMLS ID #73534905, The Residential Group, Coldwell Banker Realty - Brookline. MLS PIN
- $372,5001.86 Acres312 Wethersfield St, Rowley, MA 01969Lot/LandMLS ID #73319327, The North Shore Realty Group, eXp Realty LLC. MLS PIN
- $209,0001.79 Acres6 Applegate Lane, Kittery, ME 03904Active
 MLS ID #1666453, Portside Real Estate Group. Maine Listings
 - $250,0001 Acres0 Franks Fort Island, Eliot, ME 03903ActiveMLS ID #1650383, Abigail Douris Real EstateLLC. Maine Listings
- $195,000-- sqftSLIP 11 LITTLE BAY MARINA #11, Dover, NH 03820ActiveMLS ID #5093269, Jamieson Duston. PrimeMLS
- $189,500-- sqftSLIP 28 LITTLE BAY MARINA #28, Dover, NH 03820ActiveMLS ID #5080024, Jamieson Duston. PrimeMLS
- $195,000-- sqftSLIP 13 LITTLE BAY MARINA #13, Dover, NH 03820ActiveMLS ID #5078098, Jamieson Duston. PrimeMLS
- $149,9000.35 Acres117 Dewey Ave, Haverhill, MA 01832Lot/LandMLS ID #73488350, Fermin Group, Century 21 North East. MLS PIN
- $298,9000.69 Acres266 Route 125, Brentwood, NH 03833ActiveMLS ID #5079291, Mike Giannone. PrimeMLS
