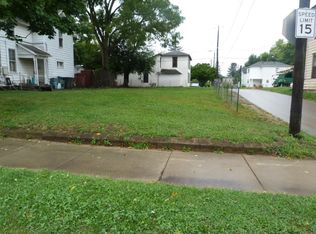
Investor Bundle Package! Three vacant lots sold together for $24k or separately for just $8k! 441 E Euclid Ave, 1002 S Yellow Springs St, and 1823 Clay St.
Unlock the potential of three strategically located vacant lots in established Springfield neighborhoods--offered as one investment bundle. Whether you're an experienced investor expanding your portfolio or a new developer ready to break ground, this package delivers flexibility, visibility, and strong long-term upside. Situated in areas with existing residential homes and steady rental demand, these parcels offer the perfect canvas for a variety of development strategies. Consider building single-family homes, tiny home communities, modular builds, or long-term buy-and-hold new construction rentals. With city utilities nearby and flat, usable terrain, each lot provides a straightforward path from concept to construction.
Springfield continues to show growth in housing need, making now the ideal time to build.
Bring your vision and creativity--these lots are the blank slate you've been waiting for. Investors, builders, and developers: seize this rare opportunity to shape a multi-site project in a steadily developing market. Don't miss the chance to secure three buildable lots with endless potential.
Pending
$8,000
441 E Euclid Ave, Springfield, OH 45505
--beds
0baths
9,147Square Feet
Unimproved Land
Built in ----
9,147 Square Feet Lot
$-- Zestimate®
$--/sqft
$-- HOA
What's special
City utilities nearbyStrategically located vacant lotsFlat usable terrainThree buildable lots
- 262 days
- 10
- 0
Zillow last checked:
Listing updated:
Listed by:
Leslie Wade,
Glasshouse Realty Group LLC
Source: WRIST,MLS#: 1043859
Facts & features
Interior
Bedrooms & bathrooms
- Bathrooms: 0
Features
- Has fireplace: No
Property
Lot
- Size: 9,147 Square Feet
- Dimensions: 56 x 166
- Features: Residential Lot
Details
- Parcel number: 3400700034414012
Community & HOA
Community
- Subdivision: Tibbetts
Location
- Region: Springfield
Financial & listing details
- Tax assessed value: $2,560
- Annual tax amount: $40
- Date on market: 2/19/2026
- Listing terms: Cash
Estimated market value
Not available
Estimated sales range
Not available
Not available
Price history
| Date | Event | Price |
|---|---|---|
| 3/9/2026 | Pending sale | $8,000 |
Source:  WRIST #1043859 Report a problem | ||
| 2/19/2026 | Listed for sale | $8,000+108.7% |
Source: WRIST #1043859 Report a problem | ||
| 10/17/2022 | Sold | $3,833-30.3% |
Source:  Columbus and Central Ohio Regional MLS #222012164 Report a problem | ||
| 10/8/2022 | Pending sale | $5,500 |
Source: Columbus and Central Ohio Regional MLS #222012164 Report a problem | ||
| 9/15/2022 | Price change | $5,500-8.3% |
Source: Columbus and Central Ohio Regional MLS #222012164 Report a problem | ||
| 8/31/2022 | Listed for sale | $5,999 |
Source: Columbus and Central Ohio Regional MLS #222012164 Report a problem | ||
| 7/20/2022 | Listing removed | -- |
Source: Columbus and Central Ohio Regional MLS #222012164 Report a problem | ||
| 6/20/2022 | Price change | $5,999-25% |
Source: Columbus and Central Ohio Regional MLS #222012164 Report a problem | ||
| 5/30/2022 | Price change | $7,999-11.1% |
Source: Columbus and Central Ohio Regional MLS #222012164 Report a problem | ||
| 5/21/2022 | Price change | $8,999-10% |
Source: Columbus and Central Ohio Regional MLS #222012164 Report a problem | ||
| 4/25/2022 | Price change | $9,999-23.1% |
Source: Columbus and Central Ohio Regional MLS #222012164 Report a problem | ||
| 4/18/2022 | Listed for sale | $12,999+8.3% |
Source: Columbus and Central Ohio Regional MLS #222012164 Report a problem | ||
| 4/2/2018 | Listing removed | $12,000 |
Source: Roost Real Estate Co. #380566 Report a problem | ||
| 3/28/2017 | Price change | $12,000-4% |
Source: Roost Real Estate Co. #380566 Report a problem | ||
| 10/3/2016 | Listed for sale | $12,500-53.2% |
Source: Roost Real Estate Co. #380566 Report a problem | ||
| 9/7/2005 | Sold | $26,700 |
Source: Public Record Report a problem | ||
Public tax history
| Year | Property taxes | Tax assessment |
|---|---|---|
| 2025 | $40 +2.6% | $900 +16.9% |
| 2024 | $39 +2.6% | $770 |
| 2023 | $38 -2.4% | $770 |
| 2022 | $39 +10.7% | $770 +20.3% |
| 2021 | $35 -0.1% | $640 |
| 2020 | $35 -98.5% | $640 -80.1% |
| 2019 | $2,285 -39.6% | $3,220 -44.2% |
| 2018 | $3,784 | $5,770 +0% |
| 2017 | $3,784 +82.7% | $5,769 |
| 2016 | $2,071 +62.4% | $5,769 +2.8% |
| 2015 | $1,275 | $5,611 |
| 2014 | $1,275 +293.2% | $5,611 |
| 2013 | $324 -42% | $5,611 -44.3% |
| 2012 | $559 -2% | $10,070 |
| 2011 | $570 +4.7% | $10,070 |
| 2010 | $545 -6.4% | $10,070 -12% |
| 2009 | $582 +3% | $11,446 |
| 2008 | $565 +1.3% | $11,446 |
| 2007 | $558 +47.8% | $11,446 +59.3% |
| 2006 | $377 +1479% | $7,186 -34% |
| 2005 | $24 -97.2% | $10,892 +0% |
| 2004 | $844 +13% | $10,890 +15% |
| 2003 | $747 -0.2% | $9,470 |
| 2002 | $748 +22.8% | $9,470 +21.4% |
| 2000 | $609 | $7,800 |
Find assessor info on the county website
Monthly payment
Est. payment
Payment breakdown
Explore the cost of this home by adjusting the details. Changes won't be saved.Climate risks
Neighborhood: 45505

Similar homes
- $7,9994,769 sqft453 E Pleasant St, Springfield, OH 45505Lot/Land

 MLS ID #930327, Kim M Williams, Howard Hanna Real Estate Serv. DABR MLS
- $8,0004,861 sqft327 N Yellow Springs St, Springfield, OH 45504Lot/Land
 MLS ID #966352, E. Lee Henderson, Henderson Land Investment Co. DABR MLS
- $10,0003,632 sqftN/a Burrowes Blvd, Fairborn, OH 45324Lot/Land
 MLS ID #972168, Terry Blakley, RE/MAX Victory + Affiliates. DABR MLS
