This home offers plenty of potential for a buyer ready to make it their own with a large yard for all your family get togethers. The interior would benefit from cosmetic improvements and some TLC to restore its charm. Bring your ideas and transform this property into a wonderful home. Conveniently located near shopping, schools, public transportation, and major routes. Whether you're looking for your next renovation project, an investment opportunity or a chance to create your dream home, this is the one you don't want to miss! Buyers and Buyers Agents responsible to do their own due diligence.Home sold in "AS IS" condition. OPEN HOUSE TODAY?? 12:00-1:15
For sale
$419,999
441 N Quincy St, Brockton, MA 02302
3beds
1,344sqft
Single Family Residence
Built in 1966
0.65 Acres Lot
$425,700 Zestimate®
$312/sqft
$-- HOA
What's special
- 20 days
- 2,081
- 105
Likely to sell faster than
Zillow last checked:
Listing updated:
Listed by:
William Roberts 774-263-9265,
Cape Cod Ken Real Estate 508-837-9936,
Kenneth Leonard 508-837-9936
Source: MLS PIN,MLS#: 73586291
Facts & features
Interior
Bedrooms & bathrooms
- Bedrooms: 3
- Bathrooms: 2
- Full bathrooms: 2
Heating
- Forced Air
Cooling
- Central Air
Features
- Basement: Full,Finished,Walk-Out Access,Interior Entry
- Number of fireplaces: 2
Interior area
- Total structure area: 1,344
- Total interior livable area: 1,344 sqft
- Finished area above ground: 1,344
Property
Parking
- Total spaces: 3
- Parking features: Paved Drive, Off Street
- Uncovered spaces: 3
Lot
- Size: 0.65 Acres
Details
- Parcel number: 973224
- Zoning: R1C
Construction
Type & style
- Home type: SingleFamily
- Architectural style: Ranch
- Property subtype: Single Family Residence
Materials
- Foundation: Concrete Perimeter
Condition
- Year built: 1966
Utilities & green energy
- Sewer: Public Sewer
- Water: Public
Community & HOA
HOA
- Has HOA: No
Location
- Region: Brockton
Financial & listing details
- Price per square foot: $312/sqft
- Tax assessed value: $532,200
- Annual tax amount: $6,189
- Date on market: 10/3/2026
Estimated market value
$425,700
$404,000 - $447,000
$3,430/mo
Price history
| Date | Event | Price |
|---|---|---|
| 10/3/2026 | Listed for sale | $419,999+40%$312/sqft |
Source: MLS PIN #73586291 Report a problem | ||
| 9/25/2026 | Sold | $300,000+35.1%$223/sqft |
Source: Public Record Report a problem | ||
| 2/11/2016 | Sold | $222,000$165/sqft |
Source: Public Record Report a problem | ||
Public tax history
| Year | Property taxes | Tax assessment |
|---|---|---|
| 2025 | $6,168 +9% | $509,300 +8.2% |
| 2024 | $5,658 +5.4% | $470,700 +13.8% |
| 2023 | $5,367 +3.8% | $413,500 +11.7% |
| 2022 | $5,172 +11.2% | $370,200 +15.4% |
| 2021 | $4,653 -4.6% | $320,900 -0.3% |
| 2020 | $4,878 +2.8% | $322,000 +5.4% |
| 2019 | $4,747 +3% | $305,500 +6.5% |
| 2018 | $4,608 +3.3% | $286,900 +3.5% |
| 2017 | $4,461 +2.7% | $277,100 +10.7% |
| 2016 | $4,345 +5.6% | $250,300 +10.4% |
| 2015 | $4,116 +3.2% | $226,800 +3% |
| 2014 | $3,990 -1.7% | $220,100 -8.4% |
| 2013 | $4,058 +1% | $240,400 -3.4% |
| 2012 | $4,017 +7.1% | $248,900 +1.4% |
| 2011 | $3,752 +10.4% | $245,400 -0.6% |
| 2010 | $3,400 +2.8% | $246,900 -17.1% |
| 2009 | $3,307 +5.4% | $297,900 -8.9% |
| 2008 | $3,139 -3.7% | $327,000 -5.8% |
| 2007 | $3,260 +12.7% | $347,200 +14.5% |
| 2006 | $2,892 +2.9% | $303,100 +14.6% |
| 2005 | $2,810 -1.7% | $264,600 +6.5% |
| 2004 | $2,860 +10.1% | $248,500 +20.9% |
| 2003 | $2,598 -1.9% | $205,500 +8% |
| 2002 | $2,647 +14.4% | $190,300 +48.6% |
| 2000 | $2,313 | $128,100 |
Find assessor info on the county website
Monthly payment
Est. payment
Payment breakdown
Explore the cost of this home by adjusting the details. Changes won't be saved.Climate risks
Neighborhood: 02302


Similar homes
- $415,9993 bd2 ba1.1k sqft56 11th Ave, Brockton, MA 02302For Sale
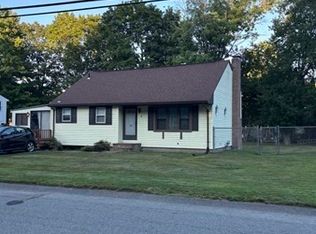 MLS ID #73591901, Ava Martin, Conway - Walpole. MLS PIN
- $449,0003 bd1 ba1.2k sqft28 Delmar Rd, Brockton, MA 02302For Sale
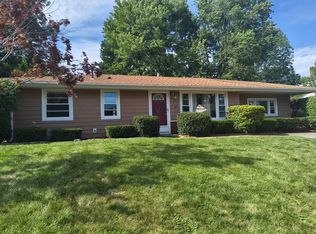 MLS ID #73560404, Danielle Milligan, Better Living Real Estate, LLC. MLS PIN
- $479,9003 bd2 ba1.4k sqft211 Alger St, Brockton, MA 02302For Sale
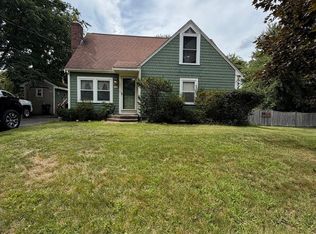 MLS ID #73578874, Eileen Prisco, Prisco's Five Star Real Estate. MLS PIN
- $429,9003 bd1 ba1.6k sqft152 Drew Ave, Brockton, MA 02302For Sale
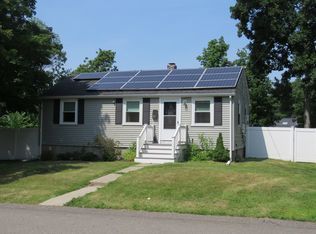 MLS ID #73551175, Paul White, Keller Williams Realty Signature Properties. MLS PIN
