3 beds/1 bath ....Homes does need rehab...Perfect for investor to add to portfolio.
For sale
$45,000
4417 Ryan St, Memphis, TN 38127
3beds
864sqft
Single Family Residence
Built in 1960
5,227 Square Feet Lot
$-- Zestimate®
$52/sqft
$-- HOA
What's special
- 11 days
- 164
- 9
Likely to sell faster than
Zillow last checked:
Listing updated:
Listed by:
Mae R Moore,
Crye-Leike, Inc., REALTORS 901-756-8100
Source: MAAR,MLS#: 10232011
Facts & features
Interior
Bedrooms & bathrooms
- Bedrooms: 3
- Bathrooms: 1
- Full bathrooms: 1
Primary bedroom
- Dimensions: 0 x 0
Dining room
- Dimensions: 0 x 0
Living room
- Dimensions: 0 x 0
Den
- Dimensions: 0 x 0
Heating
- Other (See REMARKS)
Cooling
- Other (See REMARKS)
Features
- Other (See Remarks), Square Feet Source: AutoFill (MAARdata) or Public Records (Cnty Assessor Site)
- Has fireplace: No
Interior area
- Total interior livable area: 864 sqft
Property
Parking
- Parking features: Other (See REMARKS)
Features
- Stories: 1
- Exterior features: Other (See REMARKS)
- Pool features: None
Lot
- Size: 5,227 Square Feet
- Dimensions: 50 x 113
- Features: Some Trees, Level
Details
- Parcel number: 071065 00011
Construction
Type & style
- Home type: SingleFamily
- Architectural style: Other (See Remarks)
- Property subtype: Single Family Residence
Condition
- New construction: No
- Year built: 1960
Community & HOA
Community
- Subdivision: Ridgegrove B
Location
- Region: Memphis
Financial & listing details
- Price per square foot: $52/sqft
- Tax assessed value: $70,900
- Annual tax amount: $934
- Price range: $45K - $45K
- Date on market: 10/8/2026
Estimated market value
Not available
Estimated sales range
Not available
$1,069/mo
Price history
| Date | Event | Price |
|---|---|---|
| 10/8/2026 | Listed for sale | $45,000-25%$52/sqft |
Source:  MAAR #10232011 Report a problem | ||
| 4/29/2026 | Listing removed | $60,000$69/sqft |
Source: MAAR #10195261 Report a problem | ||
| 8/18/2025 | Price change | $60,000-14.3%$69/sqft |
Source: MAAR #10195261 Report a problem | ||
| 8/1/2025 | Price change | $70,000-12.5%$81/sqft |
Source: MAAR #10195261 Report a problem | ||
| 7/8/2025 | Listed for sale | $80,000$93/sqft |
Source: MAAR #10195261 Report a problem | ||
| 5/30/2025 | Pending sale | $80,000$93/sqft |
Source: MAAR #10195261 Report a problem | ||
| 4/28/2025 | Listed for sale | $80,000+2106.9%$93/sqft |
Source: MAAR #10195261 Report a problem | ||
| 7/28/2010 | Sold | $3,625-34.1%$4/sqft |
Source: Public Record Report a problem | ||
| 8/19/2008 | Sold | $5,500-87.7%$6/sqft |
Source: Public Record Report a problem | ||
| 5/18/2007 | Sold | $44,776+11.9%$52/sqft |
Source: Public Record Report a problem | ||
| 7/12/1999 | Sold | $40,000+344.4%$46/sqft |
Source: Public Record Report a problem | ||
| 1/15/1999 | Sold | $9,000-52.6%$10/sqft |
Source: Public Record Report a problem | ||
| 2/23/1998 | Sold | $19,000-17.4%$22/sqft |
Source: Public Record Report a problem | ||
| 4/23/1997 | Sold | $23,000$27/sqft |
Source: Public Record Report a problem | ||
Public tax history
| Year | Property taxes | Tax assessment |
|---|---|---|
| 2025 | $934 +11.5% | $17,725 +39.3% |
| 2024 | $838 +8.1% | $12,725 |
| 2023 | $775 | $12,725 |
| 2022 | -- | $12,725 +335% |
| 2021 | -- | $2,925 +23.2% |
| 2020 | $76 | $2,375 |
| 2019 | $76 -21.1% | $2,375 |
| 2018 | $96 -45.1% | $2,375 |
| 2017 | $175 +304.5% | $2,375 +86.3% |
| 2016 | $43 -87.2% | $1,275 |
| 2014 | $338 | $1,275 |
| 2013 | -- | $1,275 -88% |
| 2012 | -- | $10,600 |
| 2011 | -- | $10,600 |
| 2010 | -- | $10,600 |
| 2009 | -- | $10,600 -18.9% |
| 2008 | -- | $13,075 |
| 2007 | -- | $13,075 |
| 2006 | -- | $13,075 |
| 2005 | -- | $13,075 +23.9% |
| 2004 | -- | $10,550 |
| 2003 | -- | $10,550 |
| 2002 | -- | $10,550 |
| 2001 | -- | $10,550 +27.9% |
| 2000 | -- | $8,250 |
Find assessor info on the county website
Monthly payment
Est. payment
Payment breakdown
Explore the cost of this home by adjusting the details. Changes won't be saved.Climate risks
Neighborhood: Shelby Forest-Frayser

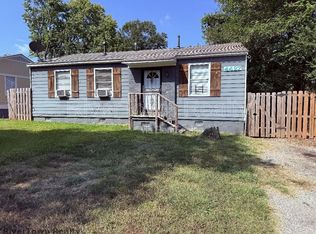
Similar homes
- $35,0002 bd1 ba803 sqft3115 Morningside St, Memphis, TN 38127For Sale
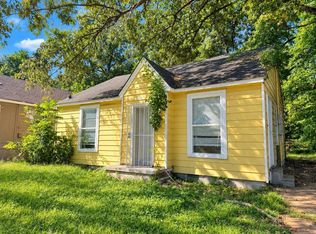 MLS ID #10232652, Tyler Tapley, Crye-Leike, Inc., REALTORS. MAAR
- $49,9002 bd1 ba1.2k sqft2330 Slocum Ave, Memphis, TN 38127For Sale
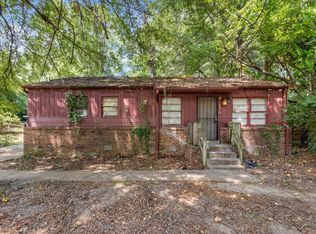 MLS ID #10229320, Michelle Woodland-Lidster, Mainstay Brokerage, LLC. MAAR
- $35,0002 bd1 ba792 sqft3088 Harvester Ln, Memphis, TN 38127For Sale
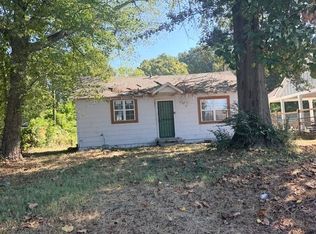 MLS ID #10232649, Tyler Tapley, Crye-Leike, Inc., REALTORS. MAAR
- $50,0003 bd1 ba791 sqft2700 Beechmont St, Memphis, TN 38127For Sale
 MLS ID #10229410, Lucille Wallace, Integrated Assets. MAAR
