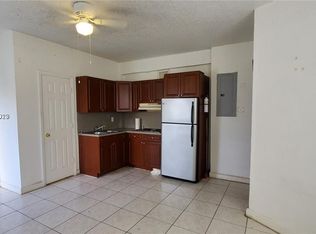
Excellent Income Producer $$ on zone T5-O potential Multifamily / Commercial space mix used or development opportunity in a desirable area. Centrally located near Expressway Airport, Wynwood. Current fully occupied a total of 3 units (one 2 bed 1 bath, 2 units 1 bed 1 bath )currently occupy units one 1 year lease $1,500.00 per month the other month to month $1,300.00. Excellent income generator. Roof and A/C central unit on main house installed within last 2 years.
Under contract
$399,999
4419 NW 17th Ave, Miami, FL 33142
4beds
3baths
1,652sqft
Duplex
Built in 1938
-- sqft lot
$-- Zestimate®
$242/sqft
$-- HOA
What's special
- 256 days
- 37
- 3
Zillow last checked:
Listing updated:
Listed by:
Antonio Gutierrez 305-215-4501,
Carmona Realty Group, LLC.
Source: MIAMI,MLS#: A11980250 Originating MLS: A-Miami Association of REALTORS
Facts & features
Interior
Bedrooms & bathrooms
- Bedrooms: 4
- Bathrooms: 3
Heating
- Central, Electric
Cooling
- Central Air, Electric, Wall/Window Unit(s), Zoned
Features
- Flooring: Tile
- Windows: Blinds
Interior area
- Total structure area: 1,652
- Total interior livable area: 1,652 sqft
Video & virtual tour
Property
Parking
- Total spaces: 1
Features
- Stories: 1
- Patio & porch: Patio
- Fencing: Fenced
Lot
- Features: Less Than 1/4 Acre Lot
Details
- Parcel number: 0131230370420
- Zoning: 6101
Construction
Type & style
- Home type: MultiFamily
- Property subtype: Duplex
Materials
- CBS Construction, Frame, Frame With Stucco
- Roof: Flat Roof With Facade Front,Shingle
Condition
- Year built: 1938
Utilities & green energy
- Sewer: Public Sewer
- Water: Municipal Water
Community & HOA
Community
- Subdivision: North Miami Estates
HOA
- Has HOA: No
Location
- Region: Miami
Financial & listing details
- Price per square foot: $242/sqft
- Tax assessed value: $372,928
- Annual tax amount: $4,832
- Date on market: 3/10/2026
- Listing terms: All Cash,Conventional
- Total actual rent: 3200
Estimated market value
Not available
Estimated sales range
Not available
Not available
Price history
| Date | Event | Price |
|---|---|---|
| 9/14/2026 | Pending sale | $399,999$242/sqft |
Source:  MIAMI #A11980250 Report a problem | ||
| 8/17/2026 | Price change | $399,999-6.1%$242/sqft |
Source: MIAMI #A11980250 Report a problem | ||
| 7/29/2026 | Listed for sale | $425,900$258/sqft |
Source: MIAMI #A11980250 Report a problem | ||
| 7/27/2026 | Pending sale | $425,900$258/sqft |
Source: MIAMI #A11980250 Report a problem | ||
| 7/13/2026 | Price change | $425,900-7.4%$258/sqft |
Source: MIAMI #A11980250 Report a problem | ||
| 3/10/2026 | Listed for sale | $459,900+22.6%$278/sqft |
Source: MIAMI #A11980250 Report a problem | ||
| 1/30/2025 | Sold | $375,000-5.5%$227/sqft |
Source: MIAMI #A11409663 Report a problem | ||
| 1/16/2025 | Price change | $397,000-2%$240/sqft |
Source: MIAMI #A11409663 Report a problem | ||
| 11/22/2024 | Price change | $405,000-12.9%$245/sqft |
Source: MIAMI #A11409663 Report a problem | ||
| 8/22/2024 | Price change | $465,000-12.3%$281/sqft |
Source: MIAMI #A11409663 Report a problem | ||
| 5/2/2024 | Price change | $530,000+39.5%$321/sqft |
Source: MIAMI #A11409663 Report a problem | ||
| 11/16/2023 | Pending sale | $380,000$230/sqft |
Source: MIAMI #A11409663 Report a problem | ||
| 10/30/2023 | Listed for sale | $380,000$230/sqft |
Source: MIAMI #A11409663 Report a problem | ||
| 10/23/2023 | Pending sale | $380,000$230/sqft |
Source: MIAMI #A11409663 Report a problem | ||
| 10/3/2023 | Price change | $380,000-7.3%$230/sqft |
Source: MIAMI #A11409663 Report a problem | ||
| 9/13/2023 | Listed for sale | $410,000$248/sqft |
Source: MIAMI #A11409663 Report a problem | ||
| 9/12/2023 | Pending sale | $410,000$248/sqft |
Source: MIAMI #A11409663 Report a problem | ||
| 9/5/2023 | Price change | $410,000-6.8%$248/sqft |
Source: MIAMI #A11409663 Report a problem | ||
| 8/24/2023 | Pending sale | $440,000$266/sqft |
Source: MIAMI #A11409663 Report a problem | ||
| 8/22/2023 | Price change | $440,000-7.4%$266/sqft |
Source: MIAMI #A11409663 Report a problem | ||
| 8/14/2023 | Price change | $475,000-4%$288/sqft |
Source: MIAMI #A11409663 Report a problem | ||
| 7/21/2023 | Price change | $495,000-5.7%$300/sqft |
Source: MIAMI #A11409663 Report a problem | ||
| 7/5/2023 | Price change | $525,000-11.8%$318/sqft |
Source: MIAMI #A11409663 Report a problem | ||
| 6/26/2023 | Price change | $595,000+24%$360/sqft |
Source: MIAMI #A11409663 Report a problem | ||
| 6/12/2023 | Listed for sale | $480,000$291/sqft |
Source: MIAMI #A11343443 Report a problem | ||
| 5/26/2023 | Contingent | $480,000+427.5%$291/sqft |
Source: MIAMI #A11343443 Report a problem | ||
| 5/6/2015 | Sold | $91,000+159.3%$55/sqft |
Source: Public Record Report a problem | ||
| 4/7/2014 | Sold | $35,100-79.4%$21/sqft |
Source: Public Record Report a problem | ||
| 8/17/2006 | Sold | $170,000+240%$103/sqft |
Source: Public Record Report a problem | ||
| 6/1/2001 | Sold | $50,000$30/sqft |
Source: Public Record Report a problem | ||
Public tax history
| Year | Property taxes | Tax assessment |
|---|---|---|
| 2025 | $4,832 +40.9% | $176,584 +10% |
| 2024 | $3,430 +4.2% | $160,531 +10% |
| 2023 | $3,290 +11.2% | $145,938 +10% |
| 2022 | $2,960 +13% | $132,671 +10% |
| 2021 | $2,620 +6% | $120,610 +10% |
| 2020 | $2,472 +11.1% | $109,646 +10% |
| 2019 | $2,224 +17.2% | $99,679 +10% |
| 2018 | $1,898 | $90,618 +5.2% |
| 2017 | $1,898 +4% | $86,118 +2.6% |
| 2016 | $1,824 +3.1% | $83,945 +5.5% |
| 2015 | $1,770 -10.5% | $79,602 -8.7% |
| 2014 | $1,977 -11.4% | $87,153 |
| 2013 | $2,230 | $87,153 |
Find assessor info on the county website
Monthly payment
Est. payment
Payment breakdown
Explore the cost of this home by adjusting the details. Changes won't be saved.Climate risks
Neighborhood: Liberty City


Similar homes
- $595,9006 bd3 ba1.7k sqft17th Ave Manor 2nd Addn, Miami, FL 33142For Sale
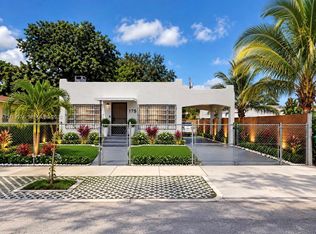
 MLS ID #A12119971, Idalia Nunez, London Foster Realty. MIAMI
- $549,0005 bd2 ba1.5k sqftFloral Park 1st Amd Pl, Miami, FL 33142For Sale
 MLS ID #A12117728, Adrian Ambros, Florida Realty of Miami Corp. MIAMI
- $499,9004 bd3 ba1.2k sqftOrange Heights, Miami, FL 33142For Sale
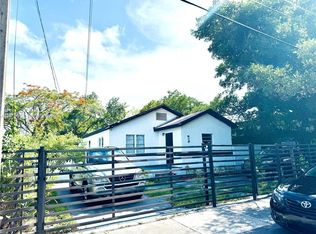 MLS ID #A12014269, Marie Etienne, First Class Real Estate, LLC.. MIAMI
- $435,0003 bd2 ba1.8k sqftThe Tropics Amd, Miami, FL 33147For Sale
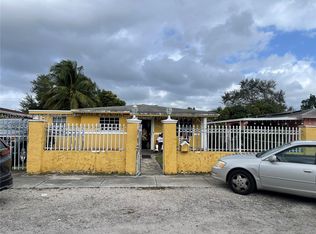 MLS ID #A12125356, Robert Henry, Charles Rutenberg Realty FTL. MIAMI
- $499,0003 bd2 ba1k sqftWest End Park Amd Pl, Miami, FL 33142For SaleMLS ID #A12067720, Maria Gomez, Luxe Properties. MIAMI
- $390,0002 bd1 ba891 sqftSerino Sub, Miami, FL 33147For SaleMLS ID #A12121487, Lenuam Garcia, The Heat Realty of S.F. LLC. MIAMI
- $350,0003 bd2 ba1.2k sqft7th Avenue Highlands, Miami, FL 33150For SaleMLS ID #A12105695, Albertson Alexandre, Real Estate Sales Force. MIAMI
- $570,0002 bd1 ba1.7k sqftHolleman Manor Addn, Miami, FL 33142For SaleMLS ID #A12066724, Dagoberto Casilla, United Real Estate Miami. MIAMI
- $515,0003 bd2 ba1.3k sqftRiverside Manor, Miami, FL 33142For SaleMLS ID #A11993323, Sara Munoz, Coldwell Banker Realty. MIAMI
- $350,0003 bd1 ba985 sqftNew Liberty City, Miami, FL 33147For SaleMLS ID #A12074141, Alejandro Patino, Lexico Realty Inc. MIAMI
- $530,0005 bd3 ba1.7k sqftWoodland Addn, Miami, FL 33147For SaleMLS ID #A12117997, Brandon Jean Baptiste, The Keyes Company. MIAMI
- $389,9992 bd2 ba1.1k sqftHollywood Beach Gardens, Hollywood, FL 33021For SaleMLS ID #A12124154, Alejandro Bruno, RE/MAX 5 Star Realty. MIAMI
- $580,0002 bd1 ba1.1k sqftFloral Pk 1st Amd, Miami, FL 33142For SaleMLS ID #A12027770, Edgardo Vera, Luxe Properties. MIAMI
- $583,0005 bd3 ba1.6k sqftGordon Dale Pk, Miami, FL 33150For SaleMLS ID #A11885364, Jose Marrero, Coldwell Banker Realty. MIAMI
- $589,0005 bd3 ba1.4k sqftGabel Sub No 4, Miami, FL 33127For SaleMLS ID #A12100789, Maiky Perez De Corcho, Elite Real Estate Worldwide Inc.. MIAMI
- $400,0003 bd1 ba1k sqftGratigny Park, Miami, FL 33168For SaleMLS ID #A12032284, Annie Shorter, Yaffe International Realty. MIAMI
- $425,0003 bd2 ba1.5k sqftOda Homes, Miami, FL 33183For SaleMLS ID #A12124078, Lourdes Baldomero, Real Estate Sales Force. MIAMI
- $480,0004 bd2 ba1.3k sqftRainbow Gardens, Opa Locka, FL 33054For SaleMLS ID #A12119907, Barclay Belizaire, Keller Williams Eagle Realty. MIAMI
- $489,9992 bd1 ba1.2k sqftSanta Clara Sub, Miami, FL 33127For SaleMLS ID #A11949489, Takasha Flowers, Dalton Wade Inc. MIAMI
- $420,0003 bd2 ba1.3k sqftFulford By The Sea Sec J, North Miami Beach, FL 33162For SaleMLS ID #A12113822, Luis Padilla, Realty One Group Royal Oaks. MIAMI
