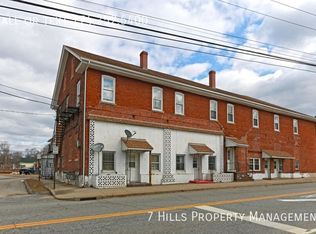
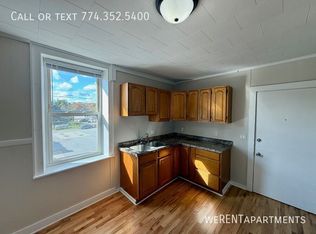
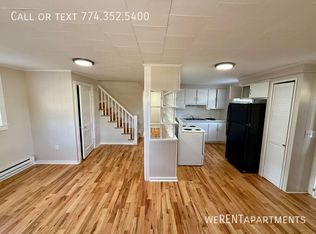
Zoned General Commercial. Multi family that need to be completely renovated or torn down. No interior access
For sale
$100,000
442 Hartford Pike, Killingly, CT 06241
3beds
4,384sqft
Multi Family
Built in 1910
-- sqft lot
$-- Zestimate®
$23/sqft
$-- HOA
What's special
- 308 days
- 913
- 43
Zillow last checked:
Listing updated:
Listed by:
Androula Kazantzis (860)208-8331,
Kazantzis Real Estate, LLC 860-774-2733
Source: Smart MLS,MLS#: 24147740
Facts & features
Interior
Bedrooms & bathrooms
- Bedrooms: 3
- Bathrooms: 2
- Full bathrooms: 2
Heating
- None
Cooling
- None
Appliances
- Included: No Hot Water
Features
- Basement: Full
- Attic: None
- Has fireplace: No
Interior area
- Total structure area: 4,384
- Total interior livable area: 4,384 sqft
- Finished area above ground: 4,384
Property
Lot
- Size: 3,484 Square Feet
- Features: Level
Details
- Parcel number: 1690987
- Zoning: GC
Construction
Type & style
- Home type: MultiFamily
- Architectural style: Units on different Floors
- Property subtype: Multi Family
Materials
- Block
- Foundation: Stone
- Roof: Asphalt
Condition
- New construction: No
- Year built: 1910
Utilities & green energy
- Sewer: Other
- Water: Public
Community & HOA
Community
- Subdivision: Dayville
HOA
- Has HOA: No
Location
- Region: Killingly
Financial & listing details
- Price per square foot: $23/sqft
- Tax assessed value: $28,000
- Annual tax amount: $668
- Date on market: 1/10/2026
Estimated market value
Not available
Estimated sales range
Not available
$1,631/mo
Price history
| Date | Event | Price |
|---|---|---|
| 10/22/2026 | Listed for sale | $100,000-33.3%$23/sqft |
Source:  Smart MLS #24147740 Report a problem | ||
| 3/6/2026 | Pending sale | $150,000$34/sqft |
Source: Smart MLS #24147740 Report a problem | ||
| 1/10/2026 | Listed for sale | $150,000+265.9%$34/sqft |
Source: Smart MLS #24147740 Report a problem | ||
| 3/18/2008 | Sold | $41,000-75.7%$9/sqft |
Source: Smart MLS #E215133 Report a problem | ||
| 2/24/2006 | Sold | $169,000$39/sqft |
Source: Public Record Report a problem | ||
Public tax history
| Year | Property taxes | Tax assessment |
|---|---|---|
| 2025 | $657 +6.3% | $28,000 |
| 2024 | $618 +2.7% | $28,000 +33.3% |
| 2023 | $602 +6.5% | $21,000 |
| 2022 | $565 -36% | $21,000 -36% |
| 2021 | $883 +59.7% | $32,830 +56.3% |
| 2020 | $553 -37.3% | $21,000 -36% |
| 2019 | $882 +51% | $32,830 +64.1% |
| 2017 | $584 -0.3% | $20,000 |
| 2015 | $586 +2.8% | $20,000 |
| 2014 | $570 -10.5% | $20,000 -30.3% |
| 2013 | $637 +4.8% | $28,700 |
| 2012 | $608 +1.8% | $28,700 |
| 2011 | $597 -53.1% | $28,700 -55.5% |
| 2010 | $1,273 | $64,470 |
| 2009 | $1,273 +10.9% | $64,470 |
| 2008 | $1,148 -34.2% | $64,470 +2% |
| 2007 | $1,744 | $63,200 |
Find assessor info on the county website
Monthly payment
Est. payment