West lancaster fixer upper with pool
Pending
$385,000
44271 Galion Ave, Lancaster, CA 93536
4beds
1,928sqft
Single Family Residence
Built in 1989
6,534 Square Feet Lot
$-- Zestimate®
$200/sqft
$-- HOA
What's special
- 19 days
- 37
- 0
Zillow last checked:
Listing updated:
Listed by:
Tifany George DRE #02073857 661-528-9910,
Keller Williams Realty A.V.
Source: GAVAR,MLS#: 26008210
Facts & features
Interior
Bedrooms & bathrooms
- Bedrooms: 4
- Bathrooms: 3
- Full bathrooms: 2
- 3/4 bathrooms: 1
Cooling
- Has cooling: Yes
Appliances
- Included: Dishwasher, Gas Oven, Gas Range, None
Features
- Has fireplace: Yes
- Fireplace features: Family Room
Interior area
- Total structure area: 1,928
- Total interior livable area: 1,928 sqft
Property
Parking
- Total spaces: 2
- Parking features: Garage
- Garage spaces: 2
Features
- Stories: 2
- Patio & porch: Covered
- Has private pool: Yes
- Pool features: In Ground
Lot
- Size: 6,534 Square Feet
Details
- Parcel number: 3124016075
- Zoning: Lrra7000
Construction
Type & style
- Home type: SingleFamily
- Property subtype: Single Family Residence
Materials
- Stucco
- Foundation: Slab
- Roof: Tile
Condition
- Year built: 1989
Utilities & green energy
- Water: Public
- Utilities for property: Natural Gas Available, Sewer Connected
Community & HOA
Location
- Region: Lancaster
Financial & listing details
- Price per square foot: $200/sqft
- Tax assessed value: $160,474
- Date on market: 10/29/2026
- Listing agreement: Exclusive Right To Sell
- Listing terms: Cash
Estimated market value
Not available
Estimated sales range
Not available
$3,503/mo
Price history
| Date | Event | Price |
|---|---|---|
| 10/29/2026 | Pending sale | $385,000$200/sqft |
Source:  GAVAR #26008210 Report a problem | ||
Public tax history
| Year | Property taxes | Tax assessment |
|---|---|---|
| 2026 | -- | $160,474 +2% |
| 2025 | $3,361 +6.4% | $157,329 +2% |
| 2024 | $3,159 +2% | $154,245 +2% |
| 2023 | $3,098 +2.8% | $151,221 +2% |
| 2022 | $3,014 +14.7% | $148,256 +2% |
| 2021 | $2,626 +1.1% | $145,350 +1% |
| 2020 | $2,599 | $143,860 +2% |
| 2019 | $2,599 +3.4% | $141,040 +2% |
| 2018 | $2,513 | $138,275 +2% |
| 2017 | $2,513 +1.1% | $135,565 +2% |
| 2016 | $2,487 +4.4% | $132,907 +1.5% |
| 2015 | $2,382 +1.3% | $130,911 +2% |
| 2014 | $2,351 | $128,348 +2.5% |
| 2012 | -- | $125,265 +2% |
| 2011 | -- | $122,810 +0.8% |
| 2010 | -- | $121,893 -0.2% |
| 2009 | -- | $122,183 +2% |
| 2008 | -- | $119,789 +6.5% |
| 2007 | -- | $112,441 +2% |
| 2006 | -- | $110,237 |
| 2005 | -- | $110,237 +4% |
| 2004 | -- | $105,958 +1.9% |
| 2003 | -- | $104,017 +2% |
| 2002 | -- | $101,979 +4% |
| 2000 | -- | $98,021 |
Find assessor info on the county website
Monthly payment
Est. payment
Payment breakdown
Explore the cost of this home by adjusting the details. Changes won't be saved.Climate risks
Neighborhood: 93536
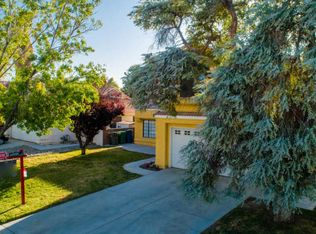
Similar homes
- $--3 bd2 ba1.9k sqft2825 Chaplin Dr, Lancaster, CA 93536Auction
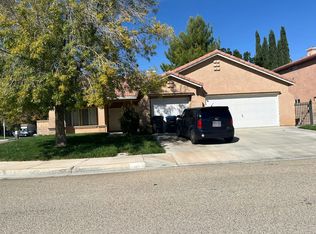 Auction.com 2
- $395,0003 bd2 ba1.6k sqft44114 Radcliff Ct, Lancaster, CA 93536For Sale
 MLS ID #26007755, Franklin Guardado. GAVAR
- $480,0003 bd3 ba1.7k sqft3337 W Avenue J2, Lancaster, CA 93536For Sale
 MLS ID #26008591, Jared B Haskell. GAVAR
- $390,0003 bd2 ba1.3k sqft44327 23rd St W, Lancaster, CA 93536For Sale
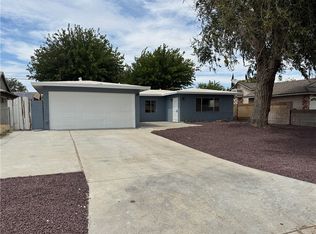 MLS ID #PW26189827, Jesus Naranjo, Michel Realty Group. CRMLS
Local buyer's agents are ready to help
