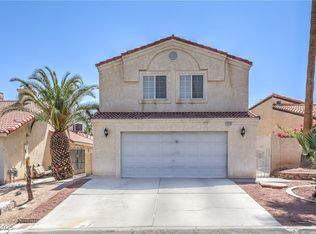
GREAT FOR INVESTORS, SINGLE STORY 3 BED 2 BATH 2 CAR GARAGE WITH NO HOA.
This property is off market, which means it's not currently listed for sale or rent on Zillow. This may be different from what's available on other websites or public sources.
$438,800
$417,000 - $461,000
$2,065/mo
$2,065/mo
Rent Zestimate®
Find your next renter with Zillow Rental Manager. Plus, with online applications, you can quickly screen prospective tenants – for free.
$2,065/mo
Rent Zestimate®
$2,530/mo
Est. payment
Refinancing to a lower rate could help reduce your monthly payments and save thousands over the life of the loan.
$2,530/mo
Est. payment
Work with a Zillow partner agent
Leverage their expertise and Zillow's premium Showcase listings to get your home seen by more buyers.
Get startedList with your own agent
Get your home in front of millions of buyers by listing it on Zillow.
Learn how to do itSell it yourself
Take full control of how buyers see your home on Zillow by listing For Sale by Owner (FSBO).
List your homeGREAT FOR INVESTORS, SINGLE STORY 3 BED 2 BATH 2 CAR GARAGE WITH NO HOA.
This property is off market, which means it's not currently listed for sale or rent on Zillow. This may be different from what's available on other websites or public sources.
Zillow last checked:
| Date | Event | Price |
|---|---|---|
| 5/31/2026 | Listing removed | $450,000$251/sqft |
Source: BHHS broker feed #2732103 Report a problem | ||
| 11/2/2025 | Listed for sale | $450,000$251/sqft |
Source: | ||
| 11/1/2025 | Listing removed | $450,000$251/sqft |
Source: BHHS broker feed #2675182 Report a problem | ||
| 4/17/2025 | Listed for sale | $450,000+4.9%$251/sqft |
Source: | ||
| 3/15/2025 | Listing removed | $429,000$239/sqft |
Source: BHHS broker feed #2176039 Report a problem | ||
| 4/6/2022 | Price change | $429,000+7.5%$239/sqft |
Source: | ||
| 9/13/2021 | Price change | $399,000+5.3%$223/sqft |
Source: | ||
| 6/6/2021 | Price change | $379,000+15.2%$211/sqft |
Source: | ||
| 5/1/2021 | Price change | $329,000+6.5%$183/sqft |
Source: | ||
| 3/19/2021 | Price change | $309,000+3.3%$172/sqft |
Source: | ||
| 2/16/2021 | Price change | $299,000+3.5%$167/sqft |
Source: Nevada Properties #2176039 Report a problem | ||
| 4/22/2019 | Listed for sale | $289,000+88.9%$161/sqft |
Source: Realty ONE Group, Inc #2090041 Report a problem | ||
| 2/14/2019 | Listing removed | $1,300$1/sqft |
Source: Monarch Property Management & #2064030 Report a problem | ||
| 1/24/2019 | Listed for rent | $1,300$1/sqft |
Source: Monarch Property Management & #2064030 Report a problem | ||
| 5/7/2015 | Sold | $153,000+1.3%$85/sqft |
Source: | ||
| 6/5/2014 | Pending sale | $151,000$84/sqft |
Source: National Real Estate #1451793 Report a problem | ||
| 6/5/2014 | Listed for sale | $151,000-22.6%$84/sqft |
Source: National Real Estate #1451793 Report a problem | ||
| 5/30/2008 | Sold | $195,000+18.3%$109/sqft |
Source: Public Record Report a problem | ||
| 4/27/2008 | Price change | $164,900-25%$92/sqft |
Source: BIRDVIEW Technologies. Inc. #816906 Report a problem | ||
| 4/13/2008 | Listed for sale | $219,900-0.4%$123/sqft |
Source: BIRDVIEW Technologies. Inc. #816906 Report a problem | ||
| 12/19/2007 | Sold | $220,809-27.1%$123/sqft |
Source: Public Record Report a problem | ||
| 4/25/2006 | Sold | $303,000+130.4%$169/sqft |
Source: Public Record Report a problem | ||
| 3/20/1998 | Sold | $131,500+1.2%$73/sqft |
Source: Public Record Report a problem | ||
| 8/22/1997 | Sold | $130,000$73/sqft |
Source: Public Record Report a problem | ||
| 11/4/1996 | Sold | $130,000$73/sqft |
Source: Public Record Report a problem | ||
| Year | Property taxes | Tax assessment |
|---|---|---|
| 2026 | $1,669 +8% | $77,691 +2.9% |
| 2025 | $1,545 +8% | $75,480 -5.6% |
| 2024 | $1,431 +8% | $79,983 +8.1% |
| 2023 | $1,326 +8% | $74,003 +10% |
| 2022 | $1,228 +7.7% | $67,288 +1.1% |
| 2021 | $1,139 +6.8% | $66,569 +2.6% |
| 2020 | $1,067 +4.8% | $64,866 +7.5% |
| 2019 | $1,019 +6.9% | $60,324 |
| 2018 | $953 | $60,324 +12.8% |
| 2017 | $953 | $53,463 +7.3% |
| 2016 | $953 +3.5% | $49,814 +27.3% |
| 2015 | $920 | $39,133 +9% |
| 2014 | $920 | $35,907 |
| 2013 | -- | $35,907 +22.9% |
| 2012 | -- | $29,221 -35.2% |
| 2011 | -- | $45,126 +5.8% |
| 2010 | -- | $42,665 -15.8% |
| 2009 | -- | $50,653 |
| 2008 | -- | $50,653 -46.6% |
| 2007 | -- | $94,845 +18.7% |
| 2006 | -- | $79,883 +37.3% |
| 2005 | -- | $58,202 +30.8% |
| 2004 | -- | $44,506 +9.5% |
| 2003 | -- | $40,663 -1.9% |
| 2002 | -- | $41,450 +1.4% |
| 2001 | -- | $40,880 |
Find assessor info on the county website