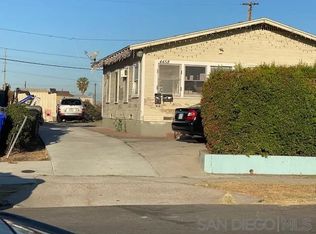
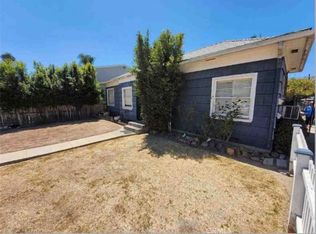
Exceptional four-unit investment opportunity at 4458 32nd St in San Diego’s Normal Heights neighborhood. Fully rented and generating approximately $10,000 per month in gross rental income—approximately $120,000 annually. The property offers a desirable mix of one detached 3-bedroom, 2-bath home, one detached 2-bedroom, 2-bath residence, and two additional 2-bedroom, 2-bath units. Features include in-unit laundry, stainless steel appliances, and on-site parking. Conveniently located near neighborhood restaurants, cafés, and shopping, with easy access to I-805 and I-8. An attractive opportunity for investors seeking existing rental income and a central San Diego location.
For sale
$2,150,000
4458 32nd St, San Diego, CA 92116
9beds
--sqft
Multi Family
Built in 2020
-- sqft lot
$2,121,600 Zestimate®
$--/sqft
$-- HOA
What's special
Stainless steel appliancesOn-site parkingIn-unit laundry
- 12 days
- 255
- 12
Zillow last checked:
Listing updated:
Listed by:
Romina Nassif DRE #02190405 619-882-4100,
Compass
Source: SDMLS,MLS#: 260025773 Originating MLS: SDMLS
Facts & features
Interior
Bedrooms & bathrooms
- Bedrooms: 9
- Bathrooms: 8
- Full bathrooms: 8
Cooling
- Central Forced Air
Interior area
- Total structure area: 3,700
Property
Features
- Levels: 2 Story
- Fencing: Partial
Details
- Parcel number: 4475340700
Construction
Type & style
- Home type: MultiFamily
- Property subtype: Multi Family
Materials
- Other/Remarks
- Roof: Other/Remarks
Condition
- Year built: 2020
Community & HOA
Community
- Security: N/K
- Subdivision: NORMAL HEIGHTS
Location
- Region: San Diego
Financial & listing details
- Tax assessed value: $2,185,860
- Date on market: 10/27/2026
- Listing terms: Cash,Conventional
- Tenant pays: N/K
Estimated market value
$2,121,600
$2.02M - $2.23M
$3,714/mo
Price history
| Date | Event | Price |
|---|---|---|
| 11/7/2026 | Listing removed | $2,800 |
Source: SDMLS #260013489 Report a problem | ||
| 10/27/2026 | Listed for sale | $2,150,000+79.9% |
Source:  SDMLS #260025773 Report a problem | ||
| 10/15/2026 | Listed for rent | $2,800-5.1% |
Source: SDMLS #260013489 Report a problem | ||
| 7/15/2026 | Listing removed | $2,950 |
Source: SDMLS #260013489 Report a problem | ||
| 7/7/2026 | Price change | $2,950+1.7% |
Source: SDMLS #260013489 Report a problem | ||
| 6/30/2026 | Price change | $2,900-7.3% |
Source: SDMLS #260013489 Report a problem | ||
| 6/4/2026 | Listed for rent | $3,128-10.6% |
Source: SDMLS #260013489 Report a problem | ||
| 4/21/2026 | Listing removed | $1,195,000-37.1% |
Source: SDMLS #210031603 Report a problem | ||
| 10/31/2025 | Listing removed | $1,900,000-11.3% |
Source: SDMLS #240009404 Report a problem | ||
| 1/16/2025 | Sold | $2,143,000+16.5% |
Source: Public Record Report a problem | ||
| 7/24/2024 | Listing removed | -- |
Source: SDMLS #240009404 Report a problem | ||
| 6/18/2024 | Price change | $1,840,000-2.6% |
Source: SDMLS #240013723 Report a problem | ||
| 6/15/2024 | Price change | $1,890,000-0.5% |
Source: SDMLS #240013723 Report a problem | ||
| 6/5/2024 | Pending sale | $1,900,000 |
Source: SDMLS #240009404 Report a problem | ||
| 5/1/2024 | Listed for sale | $1,900,000-3.8% |
Source: SDMLS #240009404 Report a problem | ||
| 5/1/2024 | Listing removed | -- |
Source: SDMLS #240005819 Report a problem | ||
| 4/10/2024 | Price change | $1,975,000-10.2% |
Source: SDMLS #240005819 Report a problem | ||
| 3/18/2024 | Listed for sale | $2,200,000+209.9% |
Source: SDMLS #240005819 Report a problem | ||
| 10/29/2023 | Listing removed | -- |
Source: Zillow Rentals Report a problem | ||
| 9/14/2023 | Price change | $3,500+66.7% |
Source: Zillow Rentals Report a problem | ||
| 9/9/2023 | Listed for rent | $2,100-40% |
Source: Zillow Rentals Report a problem | ||
| 9/29/2022 | Price change | $3,500-6.7% |
Source: Zillow Rental Manager Report a problem | ||
| 9/16/2022 | Price change | $3,750-3.8% |
Source: Zillow Rental Manager Report a problem | ||
| 9/9/2022 | Price change | $3,900+2.6% |
Source: Zillow Rental Manager Report a problem | ||
| 8/20/2022 | Listed for rent | $3,800 |
Source: Zillow Rental Manager Report a problem | ||
| 12/18/2020 | Sold | $710,000 |
Source:  Glendale AOR ZDD #200048676 Report a problem | ||
Public tax history
| Year | Property taxes | Tax assessment |
|---|---|---|
| 2026 | -- | $2,185,860 +2% |
| 2025 | $27,373 +194.7% | $2,143,000 +184.4% |
| 2024 | $9,289 +2.3% | $753,457 +2% |
| 2023 | $9,084 +2.7% | $738,684 +2% |
| 2022 | $8,842 +0.7% | $724,200 +2% |
| 2021 | $8,782 +401.3% | $710,000 +383.9% |
| 2020 | $1,752 +3.9% | $146,724 +2% |
| 2019 | $1,686 +4.9% | $143,848 +2% |
| 2018 | $1,607 +2.5% | $141,029 +2% |
| 2017 | $1,567 +1.8% | $138,265 +2% |
| 2016 | $1,539 +1.6% | $135,555 +1.5% |
| 2015 | $1,516 +1.6% | $133,520 +2% |
| 2014 | $1,492 | $130,906 +0.5% |
| 2013 | -- | $130,316 +2% |
| 2012 | -- | $127,762 +2% |
| 2011 | -- | $125,258 +0.8% |
| 2010 | -- | $124,322 -0.2% |
| 2009 | -- | $124,618 +2% |
| 2008 | -- | $122,175 +2% |
| 2007 | -- | $119,781 +2% |
| 2006 | -- | $117,434 +2% |
| 2005 | -- | $115,133 +2% |
| 2004 | -- | $112,877 +1.9% |
| 2003 | -- | $110,810 +2% |
| 2002 | -- | $108,638 +2% |
| 2001 | -- | $106,508 |
Find assessor info on the county website
Monthly payment
Est. payment
Payment breakdown
Explore the cost of this home by adjusting the details. Changes won't be saved.Climate risks
Neighborhood: Normal Heights

Similar homes
- $2,195,0009 bd8 ba-- sqft4Plex, San Diego, CA 92116For Sale
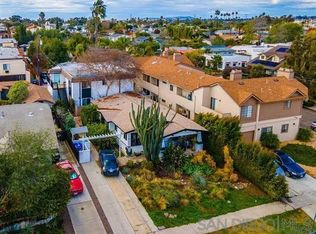 MLS ID #260026518, Josh Browar, The Browar Group. SDMLS
- $2,350,0009 bd9 ba4k sqft4669 36th St, San Diego, CA 92116For Sale
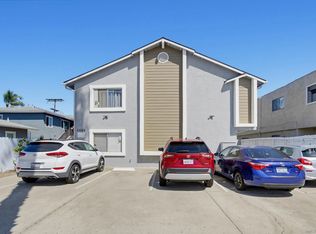 MLS ID #260022556, James V Carter, Apartment Realty Group (ARG). SDMLS
- $2,500,0006 bd6 ba3.8k sqft4218-28 Iowa St, San Diego, CA 92104For Sale
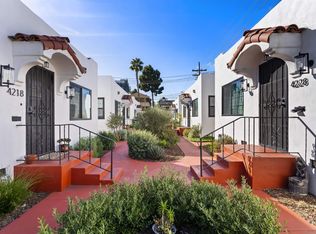 MLS ID #260026405, Aaron Bove, Colliers International SD, Inc. SDMLS
- $2,500,0008 bd3 ba2.5k sqft4448 Ohio St, San Diego, CA 92116For Sale
 MLS ID #OC26215511, Juan Lopez, Jennifer Carter Realty. CRMLS
