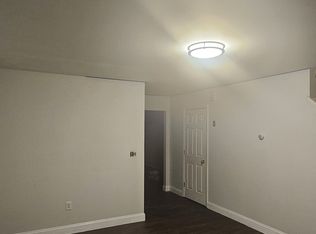
Spacious, fully updated two-family home for sale at 45 Ocean Street in Providence! This large and well-maintained property features three bedrooms on each floor, making it perfect for owner-occupants or investors seeking strong rental potential. The finished attic offers additional living space—ideal for a growing family, home office, or guest area. Beautifully updated throughout, this home provides comfort, flexibility, and excellent income potential. Don’t miss this incredible opportunity—schedule your showing today!
Pending
$665,000
45 Ocean St, Providence, RI 02905
8beds
3,387sqft
Multi Family
Built in 1930
-- sqft lot
$682,800 Zestimate®
$196/sqft
$-- HOA
What's special
- 72 days |
- 5 |
- 0 |
Zillow last checked:
Listing updated:
Listed by:
Marisela Vasquez 401-499-6945,
My Dream Home Realty
Source: StateWide MLS RI,MLS#: 1410653
Facts & features
Interior
Bedrooms & bathrooms
- Bedrooms: 8
- Bathrooms: 3
- Full bathrooms: 3
Heating
- Natural Gas, Baseboard
Cooling
- None
Appliances
- Included: Gas Water Heater
Features
- Flooring: Ceramic Tile, Hardwood
- Basement: Full,Interior Entry,Finished,Common,Laundry,Playroom,Storage Space,Utility
- Has fireplace: No
Interior area
- Total structure area: 2,726
- Total interior livable area: 3,387 sqft
Property
Parking
- Total spaces: 11
- Parking features: No Garage
- Garage spaces: 2
Features
- Patio & porch: Patio
Lot
- Size: 4,356 Square Feet
Details
- Parcel number: PROVM48L390
Construction
Type & style
- Home type: MultiFamily
- Property subtype: Multi Family
- Attached to another structure: Yes
Materials
- Vinyl Siding
Condition
- New construction: No
- Year built: 1930
Utilities & green energy
- Electric: 100 Amp Service
- Utilities for property: Sewer Connected, Water Connected
Community & HOA
HOA
- Has HOA: No
Location
- Region: Providence
Financial & listing details
- Price per square foot: $196/sqft
- Tax assessed value: $488,000
- Annual tax amount: $3,684
- Date on market: 4/21/2026
- Total actual rent: 5500
Estimated market value
$682,800
$649,000 - $717,000
$2,071/mo
Price history
| Date | Event | Price |
|---|---|---|
| 4/21/2026 | Pending sale | $665,000+189.1%$196/sqft |
Source: | ||
| 4/28/2017 | Sold | $230,000+227.1%$68/sqft |
Source: | ||
| 6/2/2016 | Sold | $70,314+2.1%$21/sqft |
Source: Public Record Report a problem | ||
| 3/3/2016 | Listed for sale | $68,900+16.2%$20/sqft |
Source: REALHome Services and Solutions #1119016 Report a problem | ||
| 8/29/2015 | Listing removed | $59,300$18/sqft |
Source: REALHome Services and Solutions Report a problem | ||
| 8/22/2015 | Listed for sale | $59,300-14.3%$18/sqft |
Source: REALHome Services and Solutions Report a problem | ||
| 6/9/2015 | Listing removed | $69,220$20/sqft |
Source: REALHome Services and Solutions Report a problem | ||
| 5/2/2015 | Price change | $69,220-12.6%$20/sqft |
Source: REALHome Services and Solutions Report a problem | ||
| 4/1/2015 | Listed for sale | $79,220$23/sqft |
Source: REALHome Services and Solutions Report a problem | ||
| 7/24/2014 | Listing removed | $79,220$23/sqft |
Source: REALHome Services and Solutions Report a problem | ||
| 2/13/2014 | Listed for sale | $79,220+76%$23/sqft |
Source: REALHome Services and Solutions Report a problem | ||
| 1/24/2014 | Sold | $45,000+1152.4%$13/sqft |
Source: Public Record Report a problem | ||
| 9/24/2012 | Sold | $3,593-82%$1/sqft |
Source: Public Record Report a problem | ||
| 7/25/1994 | Sold | $20,000$6/sqft |
Source: Public Record Report a problem | ||
Public tax history
| Year | Property taxes | Tax assessment |
|---|---|---|
| 2025 | $3,684 -40.8% | $488,000 +44% |
| 2024 | $6,219 +3.1% | $338,900 |
| 2023 | $6,032 | $338,900 |
| 2022 | $6,032 +9.3% | $338,900 +50.8% |
| 2021 | $5,519 +66.7% | $224,700 |
| 2020 | $3,311 0% | $224,700 |
| 2019 | $3,312 +17.6% | $224,700 +50% |
| 2018 | $2,816 -41.3% | $149,800 -0.3% |
| 2017 | $4,800 +80.9% | $150,200 +81% |
| 2016 | $2,653 -5.4% | $83,000 -2% |
| 2015 | $2,804 -1.9% | $84,700 |
| 2013 | $2,859 -20.7% | $84,700 -25% |
| 2012 | $3,604 | $113,000 |
| 2011 | $3,604 +5% | $113,000 |
| 2010 | $3,433 -49% | $113,000 -59.4% |
| 2009 | $6,733 +6% | $278,100 |
| 2007 | $6,352 +44% | $278,100 +90.6% |
| 2006 | $4,411 | $145,900 |
| 2005 | $4,411 | $145,900 |
Find assessor info on the county website
Monthly payment
Est. payment$--/mo
Payment breakdown
Explore the cost of this home by adjusting the details. Changes won't be saved.All calculations are estimates and provided by Zillow, Inc. for informational purposes only. Actual amounts may vary.
HOA fees may include property taxes on listings classified as Co-Ops. Contact the listing agent and/or owner for fee details.
Mortgage interest rates are dependent on a number of factors, including credit score, down payment, and repayment length. Interest rate data provided by Zillow Group Marketplace, Inc. as of 1/1/1970 from various mortgage lenders with which we have lead or other similar arrangements; the Estimated Payment is an average of those rates.
See how much you could borrow to make a competitive offer.
Climate risks
Neighborhood: Lower South Providence
Nearby schools
GreatSchools rating
- 6/10Robert L Bailey IV, Elementary SchoolGrades: K-5Distance: 0.2 mi
- 2/10Roger Williams Middle SchoolGrades: 6-8Distance: 0.4 mi
- 3/10Juanita Sanchez Educational ComplexGrades: 9-12Distance: 0.4 mi
A local agent can set up tours, give advice and negotiate with sellers.
A local lender can help you make sure your offer is ready when you are.


Nearby cities
Nearby neighborhoods
Nearby zip codes
Other Providence Topics
