$--
2 bd1 ba900 sqft
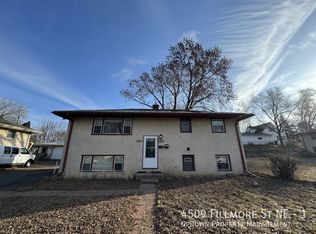
4509 Fillmore St NE UNIT 1, Minneapolis, MN 55421
Off Market
Not available
Estimated sales range
Not available
$2,619/mo
$2,619/mo
Rent Zestimate®
Find your next renter with Zillow Rental Manager. Plus, with online applications, you can quickly screen prospective tenants – for free.
$2,619/mo
Rent Zestimate®
$2,319/mo
Est. payment
Refinancing to a lower rate could help reduce your monthly payments and save thousands over the life of the loan.
$2,319/mo
Est. payment
Work with a Zillow partner agent
Leverage their expertise and Zillow's premium Showcase listings to get your home seen by more buyers.
Get startedList with your own agent
Get your home in front of millions of buyers by listing it on Zillow.
Learn how to do itSell it yourself
Take full control of how buyers see your home on Zillow by listing For Sale by Owner (FSBO).
List your homeZillow last checked:
Listing updated:
Lucas Hansen 507-402-0347,
RE/MAX Results
Jona Flores
RE/MAX Results
Tyler Walen

| Date | Event | Price |
|---|---|---|
| 10/1/2026 | Sold | $354,000+1.2%$191/sqft |
Source:  NorthstarMLS as distributed by MLS GRID #7114454 Report a problem | ||
| 9/3/2026 | Pending sale | $349,900$189/sqft |
Source: NorthstarMLS as distributed by MLS GRID #7114454 Report a problem | ||
| 8/24/2026 | Price change | $349,900-2.8%$189/sqft |
Source: NorthstarMLS as distributed by MLS GRID #7114454 Report a problem | ||
| 8/13/2026 | Price change | $359,900-2.7%$195/sqft |
Source: NorthstarMLS as distributed by MLS GRID #7114454 Report a problem | ||
| 7/30/2026 | Listed for sale | $369,900+9.8%$200/sqft |
Source: NorthstarMLS as distributed by MLS GRID #7114454 Report a problem | ||
| 5/19/2023 | Sold | $337,000+2.4%$182/sqft |
Source: NorthstarMLS as distributed by MLS GRID #6316897 Report a problem | ||
| 4/14/2023 | Pending sale | $329,000$178/sqft |
Source: NorthstarMLS as distributed by MLS GRID #6316897 Report a problem | ||
| 4/7/2023 | Listed for sale | $329,000+77.8%$178/sqft |
Source: NorthstarMLS as distributed by MLS GRID #6316897 Report a problem | ||
| 10/26/2016 | Listing removed | $1,199+41.1%$1/sqft |
Source: Renters Warehouse Report a problem | ||
| 4/29/2016 | Sold | $185,000+42.3%$100/sqft |
Source: NorthstarMLS as distributed by MLS GRID #4682250 Report a problem | ||
| 3/4/2013 | Listing removed | $850 |
Source: Advantage Real Estate and Property Management Report a problem | ||
| 2/27/2013 | Price change | $850-10.5% |
Source: Advantage Real Estate and Property Management Report a problem | ||
| 1/25/2013 | Sold | $130,000+20.4%$70/sqft |
Source: Public Record Report a problem | ||
| 1/21/2013 | Listed for rent | $950+11.8%$1/sqft |
Source: Advantage Real Estate Report a problem | ||
| 9/26/2012 | Listing removed | $850 |
Source: DMTE Enterprises Report a problem | ||
| 9/10/2012 | Listed for rent | $850 |
Source: DMTE Enterprises Report a problem | ||
| 3/7/2012 | Listing removed | $850 |
Source: DMTE Enterprises Report a problem | ||
| 1/9/2012 | Listed for rent | $850 |
Source: DMTE Enterprises Report a problem | ||
| 4/8/2011 | Listing removed | $850 |
Source: eGreen Realty Report a problem | ||
| 1/1/2011 | Listed for rent | $850 |
Source: eGreen Realty Report a problem | ||
| 8/31/2010 | Sold | $108,000-3.5%$58/sqft |
Source: Public Record Report a problem | ||
| 12/17/2009 | Listing removed | $111,900$60/sqft |
Source: Pastrana Realty, Inc. #3851005 Report a problem | ||
| 12/12/2009 | Price change | $111,900-4.9%$60/sqft |
Source: Pastrana Realty, Inc. #3851005 Report a problem | ||
| 11/25/2009 | Price change | $117,700-4.9%$64/sqft |
Source: Century 21 Pastrana #3851005 Report a problem | ||
| 11/12/2009 | Listed for sale | $123,800-57.3%$67/sqft |
Source: Century 21 Pastrana #3851005 Report a problem | ||
| 1/18/2006 | Sold | $289,900+23.4%$157/sqft |
Source: Public Record Report a problem | ||
| 2/9/2004 | Sold | $235,000+134.3%$127/sqft |
Source: Public Record Report a problem | ||
| 12/10/1999 | Sold | $100,300$54/sqft |
Source: Public Record Report a problem | ||
| Year | Property taxes | Tax assessment |
|---|---|---|
| 2025 | $4,203 -1.9% | $311,800 +10.3% |
| 2024 | $4,286 -7.4% | $282,630 -11.5% |
| 2023 | $4,626 +16% | $319,300 -0.5% |
| 2022 | $3,988 | $320,900 +35.9% |
| 2021 | -- | $236,100 +1.1% |
| 2019 | $4,039 +56.4% | $233,500 +20.8% |
| 2018 | $2,582 +10.9% | $193,300 +14.1% |
| 2017 | $2,327 +11.5% | $169,400 +10.4% |
| 2016 | $2,087 -33.8% | $153,500 |
| 2015 | $3,151 +4.2% | $153,500 |
| 2014 | $3,023 +10.6% | -- |
| 2013 | $2,734 +0.9% | -- |
| 2012 | $2,709 +2.5% | -- |
| 2011 | $2,644 -65.9% | -- |
| 2010 | $7,751 +184.4% | -- |
| 2008 | $2,726 +17.3% | -- |
| 2007 | $2,323 +6.1% | -- |
| 2006 | $2,190 +15.2% | -- |
| 2005 | $1,900 +12.5% | -- |
| 2004 | $1,689 +13% | -- |
| 2003 | $1,495 -20.7% | -- |
| 2002 | $1,884 +5.6% | -- |
| 2001 | $1,784 | -- |


An equal housing lender. NMLS #10287.
