Foreclosure Auction Ends November 16, 2026 at 9:00 AM EST. Explore this charming 3-bedroom, 2-bath residence set in a peaceful and well-located Homestead community. The list price is the opening bid for the online auction. Sold As-is. Explore more details and submit your bid through Federa Home App.
For sale
$5,000
452 SE 20th Dr, Homestead, FL 33033
3beds
1,835sqft
Single Family Residence
Built in 1995
6,098 Square Feet Lot
$-- Zestimate®
$3/sqft
$-- HOA
What's special
- 2 days
- 213
- 14
Zillow last checked:
Listing updated:
Listed by:
Jamie Boone 786-600-4465,
Jamie Boone, LLC
Source: FLKMLS,MLS#: 621929
Facts & features
Interior
Bedrooms & bathrooms
- Bedrooms: 3
- Bathrooms: 2
- Full bathrooms: 2
Interior area
- Total structure area: 1,835
- Total interior livable area: 1,835 sqft
Property
Lot
- Size: 6,098 Square Feet
Details
- Parcel number: 1079170140720
- Zoning: OTH - Other Zoning
Construction
Type & style
- Home type: SingleFamily
- Property subtype: Single Family Residence
Materials
- Other
Condition
- Year built: 1995
Utilities & green energy
- Utilities for property: See Remarks
Community & HOA
Community
- Subdivision: Other (999.9)
HOA
- Has HOA: No
- Services included: Other
Location
- Region: Homestead
Financial & listing details
- Price per square foot: $3/sqft
- Tax assessed value: $334,377
- Annual tax amount: $4,645
- Date on market: 11/4/2026
Foreclosure details
Estimated market value
Not available
Estimated sales range
Not available
$3,044/mo
Price history
| Date | Event | Price |
|---|---|---|
| 11/4/2026 | Listed for sale | $5,000-98.7%$3/sqft |
Source:  FLKMLS #621929 Report a problem | ||
| 7/26/2026 | Listing removed | $399,000$217/sqft |
Source:  MIAMI #A11963558 Report a problem | ||
| 7/24/2026 | Listed for sale | $399,000$217/sqft |
Source: MIAMI #A11963558 Report a problem | ||
| 5/29/2026 | Listing removed | $399,000$217/sqft |
Source: MIAMI #A11963558 Report a problem | ||
| 4/15/2026 | Price change | $399,000-5%$217/sqft |
Source: MIAMI #A11963558 Report a problem | ||
| 3/24/2026 | Price change | $420,000-7.7%$229/sqft |
Source: MIAMI #A11963558 Report a problem | ||
| 2/26/2026 | Price change | $454,999-3.2%$248/sqft |
Source: MIAMI #A11963558 Report a problem | ||
| 2/18/2026 | Listed for sale | $469,900+91.8%$256/sqft |
Source: MIAMI #A11963558 Report a problem | ||
| 3/5/2024 | Listing removed | -- |
Source: MIAMI #A11497892 Report a problem | ||
| 2/28/2024 | Listed for rent | $2,800-3.4%$2/sqft |
Source: MIAMI #A11497892 Report a problem | ||
| 1/31/2024 | Listing removed | -- |
Source: Zillow Rentals Report a problem | ||
| 1/24/2024 | Listed for rent | $2,900+3.6%$2/sqft |
Source: Zillow Rentals Report a problem | ||
| 1/23/2024 | Listing removed | -- |
Source: MIAMI #A11497892 Report a problem | ||
| 1/17/2024 | Price change | $2,800-3.4%$2/sqft |
Source: MIAMI #A11497892 Report a problem | ||
| 12/23/2023 | Price change | $2,900-3.3%$2/sqft |
Source: MIAMI #A11497892 Report a problem | ||
| 12/15/2023 | Price change | $3,000-3.2%$2/sqft |
Source: MIAMI #A11497892 Report a problem | ||
| 12/9/2023 | Listed for rent | $3,100+11.1%$2/sqft |
Source: MIAMI #A11497892 Report a problem | ||
| 12/8/2023 | Listing removed | -- |
Source: Zillow Rentals Report a problem | ||
| 11/28/2023 | Listed for rent | $2,790-7%$2/sqft |
Source: Zillow Rentals Report a problem | ||
| 11/15/2023 | Listing removed | -- |
Source: Zillow Rentals Report a problem | ||
| 10/26/2023 | Listed for rent | $2,999+9.1%$2/sqft |
Source: Zillow Rentals Report a problem | ||
| 3/4/2023 | Listing removed | -- |
Source: Zillow Rentals Report a problem | ||
| 3/4/2023 | Price change | $2,750+3.8%$1/sqft |
Source: Zillow Rentals Report a problem | ||
| 2/27/2023 | Price change | $2,649-1.9%$1/sqft |
Source: Zillow Rentals Report a problem | ||
| 2/22/2023 | Listed for rent | $2,699$1/sqft |
Source: Zillow Rentals Report a problem | ||
| 7/22/2020 | Sold | $245,000+172.2%$134/sqft |
Source: Public Record Report a problem | ||
| 10/31/2009 | Sold | $90,000-5.3%$49/sqft |
Source: Public Record Report a problem | ||
| 2/1/2001 | Sold | $95,000-9.5%$52/sqft |
Source: Public Record Report a problem | ||
| 12/1/1995 | Sold | $105,000$57/sqft |
Source: Public Record Report a problem | ||
Public tax history
| Year | Property taxes | Tax assessment |
|---|---|---|
| 2025 | $4,646 +4% | $230,676 +2.9% |
| 2024 | $4,469 +2.9% | $224,175 +3% |
| 2023 | $4,343 +5.9% | $217,646 +3% |
| 2022 | $4,102 +0.4% | $211,307 +3% |
| 2021 | $4,084 +3.3% | $205,153 +15.6% |
| 2020 | $3,953 +10.5% | $177,463 +10% |
| 2019 | $3,578 +4.3% | $161,330 +3.7% |
| 2018 | $3,430 | $155,599 +10% |
| 2017 | $3,430 +7.5% | $141,454 +10% |
| 2016 | $3,190 +15.7% | $128,595 +10% |
| 2015 | $2,759 +6.8% | $116,905 +10% |
| 2014 | $2,582 +34.8% | $106,278 +10% |
| 2013 | $1,915 | $96,617 +15.1% |
| 2012 | $1,915 -15.2% | $83,907 -13.3% |
| 2011 | $2,259 -12.4% | $96,800 -8.2% |
| 2010 | $2,579 -31.1% | $105,478 -34.7% |
| 2009 | $3,746 -8.7% | $161,615 -14.6% |
| 2007 | $4,103 +4.2% | $189,212 |
| 2006 | $3,937 | -- |
| 2005 | $3,937 +16.5% | -- |
| 2004 | $3,378 +31.6% | -- |
| 2003 | $2,566 +56.1% | -- |
| 2002 | $1,644 | -- |
| 2001 | $1,644 | -- |
Find assessor info on the county website
Monthly payment
Est. payment
Payment breakdown
Explore the cost of this home by adjusting the details. Changes won't be saved.Climate risks
Neighborhood: 33033

Similar homes
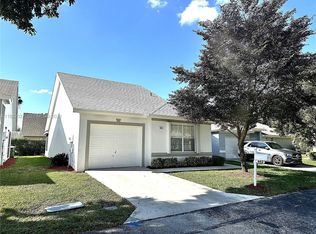
- $5,0002 bd3 ba1.4k sqft2420 SE 19th Ct, Homestead, FL 33035For Sale
 MLS ID #621930, Jamie Boone, Jamie Boone, LLC. FLKMLS
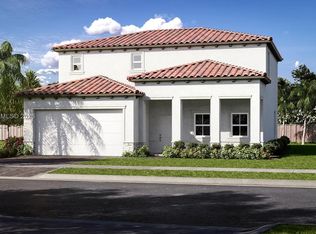
- $5,0001 bd2 ba1.8k sqft26100 SW 209th Ave, Homestead, FL 33031Auction
 MLS ID #1091374, Jamie L Boone. Space Coast AOR
- $5,0004 bd3 ba2.7k sqft12861 SW 229th Ter, Miami, FL 33170Auction
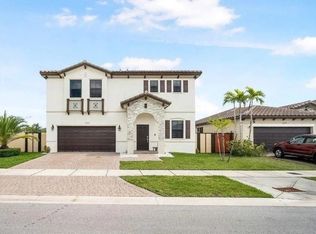 MLS ID #406803, Jamie Boone, Jamie L Boone LLC. TBR
- $5,0004 bd2 ba2.4k sqft15870 SW 105th Ave, Miami, FL 33157Auction
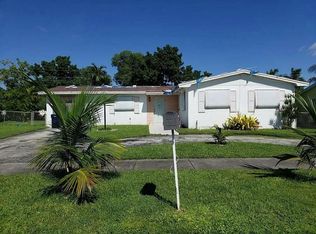 MLS ID #406804, Jamie Boone, Jamie L Boone LLC. TBR
