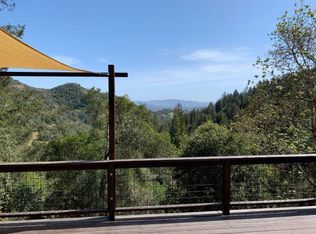
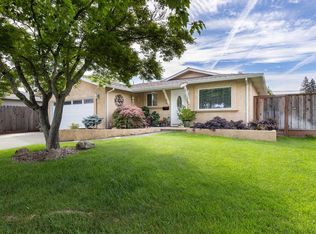
This 1649 square foot single family home has 3 bedrooms and 1.0 bathrooms. This home is located at 4598 Dry Creek Rd, Napa, CA 94558.
Pre-foreclosure
Est. $893,200
4598 Dry Creek Rd, Napa, CA 94558
3beds
1baths
1,649sqft
SingleFamily
Built in 1950
4 Acres Lot
$893,200 Zestimate®
$542/sqft
$-- HOA
Overview
- 362 days |
- 14 |
- 0 |
Facts & features
Interior
Bedrooms & bathrooms
- Bedrooms: 3
- Bathrooms: 1
Heating
- Other
Interior area
- Total interior livable area: 1,649 sqft
Property
Parking
- Parking features: Garage - Attached
Lot
- Size: 4 Acres
Details
- Parcel number: 034180002000
Construction
Type & style
- Home type: SingleFamily
Materials
- wood frame
Condition
- Year built: 1950
Community & HOA
Location
- Region: Napa
Financial & listing details
- Price per square foot: $542/sqft
- Tax assessed value: $804,239
- Annual tax amount: $9,006
Visit our professional directory to find a foreclosure specialist in your area that can help with your home search.
Find a foreclosure agentForeclosure details
Estimated market value
$893,200
$706,000 - $1.11M
$3,178/mo
Price history
| Date | Event | Price |
|---|---|---|
| 12/14/2025 | Listing removed | $875,000$531/sqft |
Source: | ||
| 7/19/2025 | Listed for sale | $875,000+140.4%$531/sqft |
Source: | ||
| 12/30/2024 | Sold | $364,000-21.7%$221/sqft |
Source: Public Record Report a problem | ||
| 10/3/2000 | Sold | $465,000$282/sqft |
Source: Public Record Report a problem | ||
Public tax history
| Year | Property taxes | Tax assessment |
|---|---|---|
| 2025 | $9,006 +20.1% | $804,239 +17.1% |
| 2024 | $7,501 +1.9% | $686,926 +2% |
| 2023 | $7,363 +1.5% | $673,458 +2% |
| 2022 | $7,253 +1.6% | $660,254 +2% |
| 2021 | $7,142 +0.8% | $647,309 +1% |
| 2020 | $7,084 +1.9% | $640,673 +2% |
| 2019 | $6,951 +1% | $628,112 +2% |
| 2018 | $6,884 +1.6% | $615,797 +2% |
| 2017 | $6,772 +1% | $603,724 +2% |
| 2016 | $6,706 +6.2% | $591,887 +1.5% |
| 2015 | $6,312 +1.4% | $582,998 +2% |
| 2014 | $6,222 +0.2% | $571,579 +0.5% |
| 2013 | $6,211 +2.8% | $568,997 +2% |
| 2012 | $6,043 +1.4% | $557,841 +2% |
| 2011 | $5,959 +2.6% | $546,904 +0.8% |
| 2010 | $5,810 -2.1% | $542,818 -0.2% |
| 2009 | $5,935 +3.7% | $544,107 +2% |
| 2008 | $5,722 +1.4% | $533,440 +2% |
| 2007 | $5,643 +4.8% | $522,981 +2% |
| 2006 | $5,387 | $512,727 +2% |
| 2005 | -- | $502,674 +2% |
| 2004 | -- | $492,818 +1.9% |
| 2003 | -- | $483,786 +2% |
| 2002 | -- | $474,300 +2% |
| 2001 | $4,667 | $465,000 +531.6% |
| 2000 | -- | $73,620 |
Find assessor info on the county website
Monthly payment
Estimated monthly payment$1,822
All calculations are estimates and provided by Zillow, Inc. for informational purposes only. Actual amounts may vary.
HOA fees may include property taxes on listings classified as Co-Ops. Contact the listing agent and/or owner for fee details.
Mortgage interest rates are dependent on a number of factors, including credit score, down payment, and repayment length. Interest rate data provided by Zillow Group Marketplace, Inc. as of 1/1/1970 from various mortgage lenders with which we have lead or other similar arrangements; the Estimated Payment is an average of those rates.
See how much you could borrow to make a competitive offer.
Climate risks
Neighborhood: 94558
Nearby schools
GreatSchools rating
- 8/10Northwood Elementary SchoolGrades: K-5Distance: 3.9 mi
- 4/10Redwood Middle SchoolGrades: 6-8Distance: 4.3 mi
- 7/10Vintage High SchoolGrades: 9-12Distance: 4.3 mi


- California
- Napa County
- Napa
- 94558
- 4598 Dry Creek Rd
Nearby cities
Nearby neighborhoods
Nearby zip codes
Other Napa Topics
