ATTN: DEVELOPERS/BUILDERS/INVESTORS - Here is your next truly "SHOVEL-READY" project W/ DEMO PERMIT IN HAND, & FULL BUILDING PERMIT SET COMPLETED! Located in a designated Opportunity Zone (OZ), this RHD-zoned downtown Beverly lot has an existing small Single Family home that is to be removed by Buyer to allow for the development of 5 Townhomes. Buyer can close with an actual BUILDING PERMIT IN HAND! Amazing downtown Beverly location: Literal steps to dining, shopping, festivals, 3 mins to beach.
Lot/land
$1,250,000
46 Federal St, Beverly, MA 01915
--beds
0baths
8,006Square Feet
Residential
Built in ----
8,006 Square Feet Lot
$1,201,200 Zestimate®
$--/sqft
$-- HOA
What's special
- 43 days
- 186
- 5
Zillow last checked:
Listing updated:
Listed by:
David Cutler 978-869-8042,
North Shore Realty Pros 978-414-5566
Source: MLS PIN,MLS#: 73588173
Facts & features
Interior
Bedrooms & bathrooms
- Bathrooms: 0
Features
- Has basement: No
Property
Features
- Waterfront features: Ocean, 1/2 to 1 Mile To Beach, Beach Ownership(Public)
Lot
- Size: 8,006 Square Feet
- Features: Other
Details
- Parcel number: M:0011 L:0161,4182053
- Zoning: RHD
Utilities & green energy
- Electric: On-Site, At Street
- Gas: At Street
- Sewer: Public Sewer, On-Site, At Street
- Water: Public, On-Site, At Street
Community & HOA
Community
- Features: Public Transportation, Shopping, Tennis Court(s), Park, Walk/Jog Trails, Golf, Medical Facility, Laundromat, Bike Path, Conservation Area, Highway Access, House of Worship, Marina, Private School, Public School, T-Station, University, Other
HOA
- Has HOA: No
Location
- Region: Beverly
Financial & listing details
- Tax assessed value: $543,800
- Annual tax amount: $5,878
- Date on market: 10/8/2026
- Electric utility on property: Yes
Estimated market value
$1,201,200
$1.14M - $1.26M
$2,620/mo
Price history
| Date | Event | Price |
|---|---|---|
| 10/8/2026 | Listed for sale | $1,250,000+39% |
Source: MLS PIN #73588173 Report a problem | ||
| 9/8/2025 | Listing removed | $899,000 |
Source: MLS PIN #73396708 Report a problem | ||
| 8/27/2025 | Contingent | $899,000 |
Source: MLS PIN #73396708 Report a problem | ||
| 6/25/2025 | Listed for sale | $899,000+81.6% |
Source: MLS PIN #73396708 Report a problem | ||
| 6/11/2025 | Sold | $495,000-3.8% |
Source: MLS PIN #73368352 Report a problem | ||
| 5/1/2025 | Listed for sale | $514,500 |
Source: MLS PIN #73368352 Report a problem | ||
Public tax history
| Year | Property taxes | Tax assessment |
|---|---|---|
| 2025 | $5,910 +11.5% | $537,800 +13.9% |
| 2024 | $5,301 +6.5% | $472,000 +6.8% |
| 2023 | $4,977 | $442,000 |
| 2022 | $4,977 +7.2% | $442,000 +20.9% |
| 2021 | $4,642 +2.2% | $365,500 +3.2% |
| 2020 | $4,544 +4.9% | $354,200 +8% |
| 2019 | $4,333 +3.1% | $328,000 +6.1% |
| 2018 | $4,202 +10.7% | $309,000 +16.3% |
| 2017 | $3,796 -0.8% | $265,800 |
| 2016 | $3,825 +2% | $265,800 |
| 2015 | $3,750 +10.8% | $265,800 +11.3% |
| 2014 | $3,383 +3.8% | $238,900 |
| 2013 | $3,259 +1.2% | $238,900 -3.8% |
| 2012 | $3,220 +4.5% | $248,300 |
| 2011 | $3,081 -0.8% | $248,300 -7% |
| 2010 | $3,106 -1.2% | $267,100 -7.8% |
| 2009 | $3,145 +0.8% | $289,600 -3.5% |
| 2008 | $3,121 +1.2% | $300,100 -1.3% |
| 2007 | $3,085 +8.2% | $304,200 +5.4% |
| 2006 | $2,852 +2.3% | $288,700 +4% |
| 2005 | $2,787 -0.1% | $277,600 +8.6% |
| 2004 | $2,791 +7.3% | $255,600 +14.1% |
| 2003 | $2,601 +6.5% | $224,000 +32.9% |
| 2001 | $2,443 +1.7% | $168,600 +1.7% |
| 2000 | $2,402 +27.9% | $165,800 +37.1% |
| 1995 | $1,878 | $120,940 |
Find assessor info on the county website
Monthly payment
Climate risks
Neighborhood: 01915


Similar homes
- $999,9992 acres180 Conant St, Danvers, MA 01923Lot/Land
 MLS ID #73506984, Chuck Madden, Century 21 North East Homes. MLS PIN
- $750,0006.6 acres27A Sagamore Ln, Boxford, MA 01921Lot/Land
 MLS ID #73600070, Cudmore and Associates, Century 21 North East. MLS PIN
- $1,050,0000.54 acres115 School St, Manchester, MA 01944Lot/Land
 MLS ID #73573263, Fabyan and Filias Team, J. Barrett & Company. MLS PIN
- $1,200,0008.31 acres0 Silvermine Lots #2B&C, Boxford, MA 01921Lot/Land
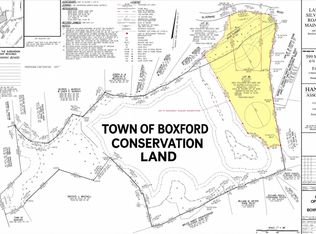 MLS ID #73600363, Stephanie Jones, Leading Edge Real Estate. MLS PIN
