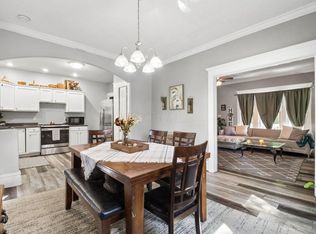
Cozy and updated, you will love this 3 bedroom 1.5 bath ranch style home with huge back yard! Neutral colors through out. Kitchen appliances convey with property. Nice owner's bedroom with en suite half bath and double closets for plenty of storage! Separate and convenient laundry room attached to the bathroom. Easy living with everything on one floor!
For sale
Price cut: $10K (10/19)
$169,999
465 Henderson Ave, Newark, OH 43055
3beds
980sqft
Single Family Residence
Built in 2001
9,147 Square Feet Lot
$-- Zestimate®
$173/sqft
$-- HOA
What's special
Neutral colors throughout
- 12 days
- 466
- 15
Likely to sell faster than
Zillow last checked:
Listing updated:
Listed by:
Jeri L Smith 740-248-9819,
Coldwell Banker Realty
Source: Columbus and Central Ohio Regional MLS ,MLS#: 226038198
Facts & features
Interior
Bedrooms & bathrooms
- Bedrooms: 3
- Bathrooms: 2
- Full bathrooms: 1
- 1/2 bathrooms: 1
- Main level bedrooms: 3
Heating
- Forced Air
Features
- Windows: Insulated Windows
- Common walls with other units/homes: No Common Walls
Interior area
- Total structure area: 980
- Total interior livable area: 980 sqft
Property
Parking
- Parking features: On Street
- Has uncovered spaces: Yes
Features
- Levels: One
Lot
- Size: 9,147 Square Feet
Details
- Parcel number: 05421654000.000
- Special conditions: Standard
Construction
Type & style
- Home type: SingleFamily
- Architectural style: Ranch
- Property subtype: Single Family Residence
Materials
- Foundation: Slab
Condition
- New construction: No
- Year built: 2001
Utilities & green energy
- Sewer: Public Sewer
- Water: Public
Community & HOA
HOA
- Has HOA: No
Location
- Region: Newark
Financial & listing details
- Price per square foot: $173/sqft
- Tax assessed value: $107,300
- Annual tax amount: $1,269
- Date on market: 10/7/2026
- Listing terms: Conventional
Estimated market value
Not available
Estimated sales range
Not available
Not available
Price history
| Date | Event | Price |
|---|---|---|
| 10/19/2026 | Price change | $169,999-5.6%$173/sqft |
Source:  Columbus and Central Ohio Regional MLS #226038198 Report a problem | ||
| 10/7/2026 | Listed for sale | $179,999+52.7%$184/sqft |
Source: Columbus and Central Ohio Regional MLS #226038198 Report a problem | ||
| 2/12/2021 | Sold | $117,900+2.6%$120/sqft |
Source: Columbus and Central Ohio Regional MLS #220037392 Report a problem | ||
| 1/18/2021 | Contingent | $114,900$117/sqft |
Source:  Columbus and Central Ohio Regional MLS #220037392 Report a problem | ||
| 1/18/2021 | Pending sale | $114,900$117/sqft |
Source: Century 21 Excellence Realty #220037392 Report a problem | ||
| 1/5/2021 | Price change | $114,900-4.3%$117/sqft |
Source: Columbus and Central Ohio Regional MLS #220037392 Report a problem | ||
| 12/18/2020 | Price change | $120,000+6.3%$122/sqft |
Source: Century 21 Excellence Realty #220037392 Report a problem | ||
| 10/26/2020 | Pending sale | $112,900$115/sqft |
Source: Century 21 Excellence Realty #220037392 Report a problem | ||
| 10/22/2020 | Listed for sale | $112,900+41.1%$115/sqft |
Source: Century 21 Excellence Realty #220037392 Report a problem | ||
| 7/11/2019 | Sold | $80,000+14.9%$82/sqft |
Source: Columbus and Central Ohio Regional MLS #219019992 Report a problem | ||
| 6/7/2019 | Listed for sale | $69,629+32.6%$71/sqft |
Source: HER Realtors #219019992 Report a problem | ||
| 5/8/2018 | Listing removed | $795$1/sqft |
Source: The Trinity Group at HER Realtors LLC - Property # 505182 Report a problem | ||
| 4/9/2018 | Listed for rent | $795$1/sqft |
Source: The Trinity Group at HER Realtors LLC - Property # 505182 Report a problem | ||
| 7/8/2017 | Listing removed | $795$1/sqft |
Source: HER Realtors Report a problem | ||
| 6/23/2017 | Listed for rent | $795$1/sqft |
Source: HER Realtors Report a problem | ||
| 2/27/2017 | Sold | $52,500-4.5%$54/sqft |
Source: Columbus and Central Ohio Regional MLS #217001628 Report a problem | ||
| 1/20/2017 | Listed for sale | $55,000+161.9%$56/sqft |
Source: Keller Williams - Keller Williams Consultants Realty #217001628 Report a problem | ||
| 3/2/2010 | Sold | $21,000-44.7%$21/sqft |
Source: Public Record Report a problem | ||
| 9/26/2009 | Listed for sale | $38,000-47.9%$39/sqft |
Source: Carleton Realty Report a problem | ||
| 9/28/2005 | Sold | $72,900+386%$74/sqft |
Source: Public Record Report a problem | ||
| 4/15/1996 | Sold | $15,000$15/sqft |
Source: Public Record Report a problem | ||
Public tax history
| Year | Property taxes | Tax assessment |
|---|---|---|
| 2025 | $1,379 +2.6% | $37,555 |
| 2024 | $1,344 +0.2% | $37,555 |
| 2023 | $1,341 +10.1% | $37,555 |
| 2022 | $1,218 -4.6% | -- |
| 2021 | $1,278 +16.5% | -- |
| 2020 | $1,096 +15.6% | -- |
| 2019 | $948 -0.1% | -- |
| 2018 | $949 -20.8% | -- |
| 2017 | $1,198 +51.6% | -- |
| 2016 | $790 -2.1% | -- |
| 2015 | $807 | -- |
| 2014 | $807 +5.9% | -- |
| 2013 | $763 -23.2% | -- |
| 2012 | $993 -1.8% | -- |
| 2011 | $1,012 +35.4% | -- |
| 2010 | $748 | $16,980 -34% |
| 2009 | -- | $25,730 |
| 2008 | $943 +0.3% | $25,730 +1.8% |
| 2007 | $940 +0.5% | $25,270 |
| 2006 | $936 +1.1% | $25,270 |
| 2005 | $926 +23.9% | $25,270 +25.1% |
| 2004 | $747 +17.3% | $20,200 |
| 2003 | $637 -0.7% | $20,200 |
| 2002 | $642 | $20,200 |
Find assessor info on the county website
Monthly payment
Est. payment
Payment breakdown
Explore the cost of this home by adjusting the details. Changes won't be saved.Climate risks
Neighborhood: 43055

Similar homes
- $180,0002 bd1 ba784 sqft300 N Buena Vista St, Newark, OH 43055For Sale

 MLS ID #226022791, Alexis Kathryn Vance, RIHL Realty. Columbus and Central Ohio Regional MLS
- $178,0003 bd1 ba1.2k sqft59 N Fulton Ave, Newark, OH 43055For Sale
 MLS ID #226033577, Juleah Angus, Coldwell Banker Realty. Columbus and Central Ohio Regional MLS
- $200,0003 bd1 ba1k sqft555 Kibler Ave, Newark, OH 43055For Sale
 MLS ID #226037679, Antwon Jones, Coldwell Banker Realty. Columbus and Central Ohio Regional MLS
- $149,9003 bd2 ba1.2k sqft195 Clinton St, Newark, OH 43055For Sale
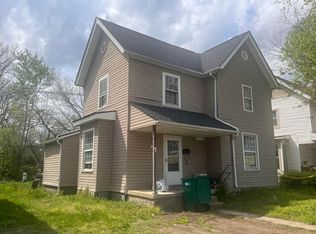 MLS ID #226030296, Kristen Du Kidder, Red 1 Realty. Columbus and Central Ohio Regional MLS
- $200,0002 bd1 ba840 sqft501 Wehrle Ave, Newark, OH 43055For SaleMLS ID #226031106, Marilyn R Swackhammer, Heart of It All. Columbus and Central Ohio Regional MLS
- $220,0003 bd1 ba1.4k sqft24 N Hazelwood Ave, Newark, OH 43055For SaleMLS ID #226035030, Daniel K Swick, Howard Hanna Real Estate Services. Columbus and Central Ohio Regional MLS
- $252,9002 bd2 ba1k sqft47 Northpointe Ln, Newark, OH 43055For SaleMLS ID #226039766, Kelly A Parker, Howard Hanna Real Estate Svcs. Columbus and Central Ohio Regional MLS
- $204,9003 bd2 ba1.2k sqft128 N 9th St, Newark, OH 43055For SaleMLS ID #226029071, Amanda Kranyik, Red 1 Realty. Columbus and Central Ohio Regional MLS
- $190,0002 bd1 ba966 sqft990 Woodlawn Ave, Newark, OH 43055For SaleMLS ID #226029099, Raquel Drouillard, Triumph Realty . Columbus and Central Ohio Regional MLS
- $169,9002 bd2 ba972 sqft133 N Terrace Ave APT B, Newark, OH 43055For SaleMLS ID #226033701, Kelli A Poling, Hill Real Estate. Columbus and Central Ohio Regional MLS
- $199,9003 bd2 ba1.3k sqft64 Grant St, Newark, OH 43055For SaleMLS ID #226015126, Jerry J Adkins, Berkshire Hathaway HS Pro Rlty. Columbus and Central Ohio Regional MLS
- $172,5003 bd3 ba1.3k sqft625 Country Club Dr APT D4, Newark, OH 43055For SaleMLS ID #226035198, Hugh H Price, Howard HannaRealEstateServices. Columbus and Central Ohio Regional MLS
- $199,0002 bd1 ba840 sqft859 Jones Ave, Newark, OH 43055For Sale
 MLS ID #968869, Arthur Solomon, Coldwell Banker Heritage. DABR MLS
- $125,0003 bd1 ba995 sqft30 N Morris St, Newark, OH 43055For SaleMLS ID #226007667, Angela A Fry, Keller Williams Greater Cols. Columbus and Central Ohio Regional MLS
- $200,0002 bd2 ba1k sqft1257 Hillview Cir W, Newark, OH 43055For SaleMLS ID #226039564, Heather M Stasel, Howard Hanna Real Estate Serv. Columbus and Central Ohio Regional MLS
- $200,0003 bd1 ba1.3k sqft138 Neal Ave, Newark, OH 43055For SaleMLS ID #226025253, Hugh H Price, Howard HannaRealEstateServices. Columbus and Central Ohio Regional MLS
- $135,0003 bd1 ba1.1k sqft99 Hoover St, Newark, OH 43055For SaleMLS ID #225039698, Carly F Scarberry, List. Columbus and Central Ohio Regional MLS
- $224,9003 bd2 ba1.2k sqft1005 W Church St, Newark, OH 43055For SaleMLS ID #226020753, Kishma James, Keller Williams Greater Cols. Columbus and Central Ohio Regional MLS
- $199,0004 bd1 ba1.4k sqft57 N Pine St, Newark, OH 43055For SaleMLS ID #226023868, Sherry A Talbert, e-Merge Real Estate. Columbus and Central Ohio Regional MLS
