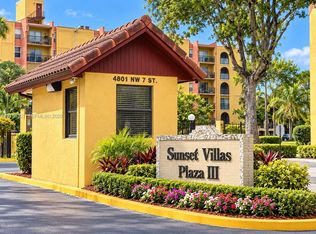
Beautifully remodeled 2/2 condo with Stunning lake views. This unit offers fully updated interior with a fresh, modern feel throughout. Enjoy peaceful water views right from your home. Conveniently located in the heart of Miami, just minutes from shopping, dining, major highways, and MIA. Move in ready and a must see!
For sale
$278,900
4717 NW 7th St APT 708-10, Miami, FL 33126
2beds
798sqft
Condominium
Built in 1974
-- sqft lot
$-- Zestimate®
$349/sqft
$580/mo HOA
What's special
Fresh modern feel throughoutStunning lake viewsFully updated interior
- 27 days
- 132
- 1
Likely to sell faster than
Zillow last checked:
Listing updated:
Listed by:
Guillermo Orjuela 786-262-3094,
1 Flamingo Realty, LLC
Source: MIAMI,MLS#: A12109239 Originating MLS: A-Miami Association of REALTORS
Facts & features
Interior
Bedrooms & bathrooms
- Bedrooms: 2
- Bathrooms: 2
- Full bathrooms: 2
Heating
- Central
Cooling
- Central Air
Appliances
- Included: Electric Range, Electric Water Heater, Refrigerator
- Laundry: Common Area
Interior area
- Total interior livable area: 798 sqft
Video & virtual tour
Property
Parking
- Parking features: 1 Space, Other
Features
- Entry location: First Floor Entry
- Exterior features: Other, Balcony
- Pool features: Association
- Has view: Yes
- View description: Lake
- Has water view: Yes
- Water view: Lake
- Waterfront features: Lake
Details
- Parcel number: 0131310184280
Construction
Type & style
- Home type: Condo
- Property subtype: Condominium
- Attached to another structure: Yes
Materials
- Concrete Block Construction
Condition
- Completely Renovated
- Year built: 1974
Community & HOA
Community
- Security: Security Service
- Application fee: $150
- Subdivision: Sunset Villas No 3 Condo
HOA
- Has HOA: Yes
- Amenities included: Pool
- HOA fee: $580 monthly
Location
- Region: Miami
Financial & listing details
- Price per square foot: $349/sqft
- Tax assessed value: $221,560
- Annual tax amount: $4,251
- Date on market: 10/19/2026
- Listing terms: All Cash,Conventional
Estimated market value
Not available
Estimated sales range
Not available
Not available
Price history
| Date | Event | Price |
|---|---|---|
| 10/21/2026 | Listed for sale | $278,900+11.6%$349/sqft |
Source:  MIAMI #A12109239 Report a problem | ||
| 3/8/2026 | Listing removed | $2,550$3/sqft |
Source: MIAMI #A11758743 Report a problem | ||
| 3/7/2025 | Listed for rent | $2,550$3/sqft |
Source: MIAMI #A11758743 Report a problem | ||
| 1/26/2024 | Sold | $250,000-2%$313/sqft |
Source: MIAMI #A11445648 Report a problem | ||
| 10/31/2023 | Price change | $255,000-5.6%$320/sqft |
Source: MIAMI #A11445648 Report a problem | ||
| 9/4/2023 | Listed for sale | $270,000+116%$338/sqft |
Source: MIAMI #A11445648 Report a problem | ||
| 10/26/2019 | Sold | $125,000$157/sqft |
Source: Public Record Report a problem | ||
Public tax history
| Year | Property taxes | Tax assessment |
|---|---|---|
| 2025 | $4,429 -0.2% | $221,560 |
| 2024 | $4,439 +13% | $221,560 +16% |
| 2023 | $3,926 +116.8% | $191,000 +47.1% |
| 2022 | $1,811 +1.1% | $129,841 +3% |
| 2021 | $1,791 +1.7% | $126,060 +1.4% |
| 2020 | $1,761 -25.7% | $124,320 +12% |
| 2019 | $2,369 +1.9% | $111,000 |
| 2018 | $2,325 | $111,000 |
| 2017 | $2,325 -1.1% | $111,000 +57.9% |
| 2016 | $2,351 +40.3% | $70,319 +10% |
| 2015 | $1,676 +11.6% | $63,927 +10% |
| 2014 | $1,502 +38.4% | $58,116 +10% |
| 2013 | $1,085 | $52,833 +10% |
| 2012 | $1,085 -20.5% | $48,030 -20% |
| 2011 | $1,366 -10.7% | $60,040 -5% |
| 2010 | $1,530 -47.4% | $63,200 -50% |
| 2009 | $2,906 -22.2% | $126,390 -25% |
| 2007 | $3,734 +28.4% | $168,520 |
| 2006 | $2,908 | -- |
| 2005 | $2,908 +6.1% | -- |
| 2004 | $2,741 +54.1% | -- |
| 2003 | $1,778 +22.9% | -- |
| 2002 | $1,447 | -- |
| 2001 | $1,447 | -- |
Find assessor info on the county website
Monthly payment
Est. payment
Payment breakdown
Explore the cost of this home by adjusting the details. Changes won't be saved.Climate risks
Neighborhood: Flagami


Similar homes
- $219,9902 bd1 ba774 sqftYolanda Villas Condo, Miami, FL 33126For Sale

 MLS ID #A12091344, Argenis Galez, LoKation. MIAMI
- $269,4002 bd2 ba1k sqftFox Chase Condo #2, Miami, FL 33126For Sale
 MLS ID #A12049221, Miranda Marrero, Casa Victoria Realty LLC. MIAMI
- $225,0002 bd1 ba750 sqftTempo Condo Ph I, Miami, FL 33126For Sale
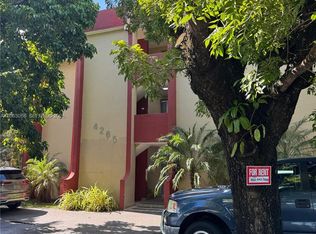 MLS ID #A12063086, Silvio Righetti, Fortune Christie's International Real Estate. MIAMI
- $184,9001 bd1 ba598 sqftYolanda Villas Condo, Miami, FL 33126For Sale
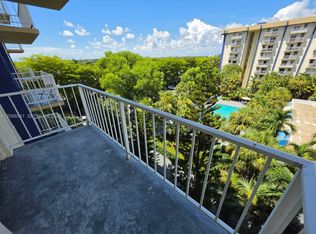 MLS ID #A12088361, Luis Pettinaro, La Rosa Realty LLC. MIAMI
- $180,0001 bd1 ba598 sqftYolanda Villas Condo, Miami, FL 33126For SaleMLS ID #A12067328, Zuleyka Candelaria Roman, Candelaria Investments Group, LLC.. MIAMI
- $210,0001 bd1 ba553 sqftSunset Villas, Miami, FL 33126For SaleMLS ID #A11728136, Francisco Rivera, Related General Realty, LLC.. MIAMI
- $284,9002 bd2 ba984 sqftHavana Lofts Condo, Miami, FL 33128For SaleMLS ID #A12032570, Edgar Vega, Avanti Way Brickell. MIAMI
- $315,0002 bd2 ba870 sqftFontainebleau Gardens, Miami, FL 33126For SaleMLS ID #A11669745, Saul Delgado, Illustrious Realty & Invest.. MIAMI
- $163,4991 bd1 ba506 sqft5050 Condo, Miami, FL 33126For SaleMLS ID #A12093576, Maria Rosado, Star Realty Advisors, Inc. MIAMI
- $250,0002 bd1 ba726 sqftMadrid Terrace Condo, Miami, FL 33144For SaleMLS ID #A11976775, Roberto Valenzuela, One Stop Realty. MIAMI
- $320,0002 bd3 ba940 sqftPark Place At Midway Cond, Miami, FL 33126For SaleMLS ID #A12070735, Elizabeth Morales, EAG Realty International Inc.. MIAMI
- $284,0002 bd2 ba1k sqftVersaille Gardens 1, Miami, FL 33174For SaleMLS ID #A12075841, Marlene Darrican, Florida Realty of Miami Corp. MIAMI
- $336,0002 bd3 ba979 sqftLaguna Condo, Miami, FL 33126For SaleMLS ID #A12091733, Maria De Matos PA, Ancara Real Estate, LLC.. MIAMI
- $240,0002 bd2 ba925 sqftWestland Courts Condo, Hialeah, FL 33012For SaleMLS ID #A12123490, Gretel Jimenez, Prestige Luxury Realty LLC. MIAMI
- $325,0002 bd2 ba906 sqftSouth Grove Plaza, Miami, FL 33133For SaleMLS ID #A12090665, Sara Maria De Los Reyes, Maria Jimenez, Realtors. MIAMI
- $285,0002 bd2 ba800 sqftWest Gardens Village Cond, Miami, FL 33172For SaleMLS ID #A11973070, Carlos Gutierrez, Best Realty of Miami. MIAMI
- $235,0002 bd1 ba726 sqftMadrid Terrace, Miami, FL 33144For SaleMLS ID #A12028992, Cary Quinn, MarketWise Realty Inc. MIAMI
- $324,0002 bd2 ba891 sqftPine Lake Village Condo, Miami, FL 33172For SaleMLS ID #A12102304, Melvin Davila, Miami Realty Dreams Inc.. MIAMI
- $300,0002 bd2 ba1k sqftLas Brisas Vilage, Miami, FL 33172For SaleMLS ID #A12059622, Luis Osio, Oasis Intl. Realty Group, LLC. MIAMI
- $250,0002 bd1 ba775 sqftAgua Dulce Condo, Sweetwater, FL 33174For SaleMLS ID #A12094980, Ana Sanchez, Montesol Realty, Inc.. MIAMI
