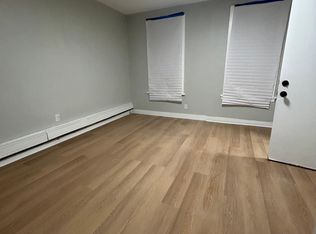
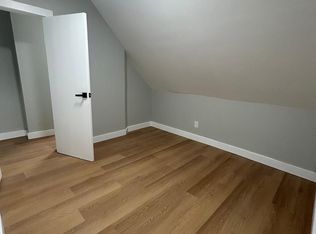
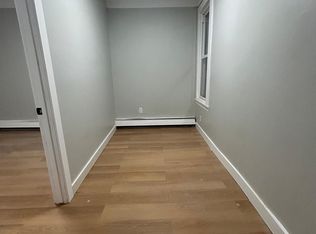
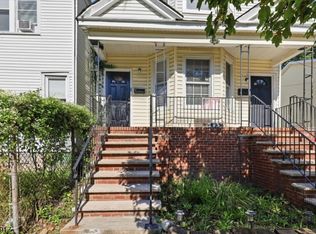
Well-maintained 2-family home in the heart of Orange offering a great opportunity for both investors and owner-occupants. The first-floor unit features a living room, kitchen, 1 bedroom, and 1 full bath. The second-floor unit offers a similar layout with a living room, kitchen, 4 bedrooms, and 1 full bath. The home also includes a basement, providing additional recreational space or office. Outside, you'll find a garage, and parking for 3+ vehicles. Conveniently located near shopping, dining, schools, public transportation, and major highways. A solid multi-family property with plenty of potential. Schedule your showing today!
For sale
Price cut: $30K (10/14)
$585,000
485 Cary St, Orange, NJ 07050
5beds
--sqft
Multi Family
Built in ----
-- sqft lot
$-- Zestimate®
$--/sqft
$-- HOA
What's special
- 31 days
- 494
- 32
Zillow last checked:
Listing updated:
Listed by:
GUSTAVO SANTACRUZ 201-766-2565,
ACCESS HOMES REALTY 201-766-2565
Source: HCMLS,MLS#: 260019209
Facts & features
Interior
Bedrooms & bathrooms
- Bedrooms: 5
- Bathrooms: 2
- Full bathrooms: 2
Heating
- Natural Gas
Cooling
- Gas
Features
- Basement: Full,Unfinished
Property
Parking
- Parking features: 3+ Cars, Garage
- Has garage: Yes
Details
- Parcel number: 1703906000000010
Construction
Type & style
- Home type: MultiFamily
- Architectural style: Colonial
- Property subtype: Multi Family
Materials
- Aluminum Siding
Community & HOA
Location
- Region: Orange
Financial & listing details
- Tax assessed value: $416,300
- Annual tax amount: $16,277
- Date on market: 9/22/2026
Estimated market value
Not available
Estimated sales range
Not available
$2,703/mo
Price history
| Date | Event | Price |
|---|---|---|
| 10/14/2026 | Price change | $585,000-4.9% |
Source: HCMLS #260019209 Report a problem | ||
| 9/22/2026 | Listed for sale | $615,000+41.4% |
Source: HCMLS #260019209 Report a problem | ||
| 12/11/2021 | Listing removed | -- |
Source: Zillow Rental Manager Report a problem | ||
| 11/29/2021 | Listed for rent | $2,400 |
Source: Zillow Rental Manager Report a problem | ||
| 11/19/2021 | Sold | $435,000+10.1% |
Source:  GSMLS #3737190 Report a problem | ||
| 9/29/2021 | Listed for sale | $395,000 |
Source: GSMLS #3737190 Report a problem | ||
| 9/18/2021 | Listing removed | -- |
Source:  New Jersey Multiple Listing Service, Inc Report a problem | ||
| 8/28/2021 | Listed for sale | $395,000+38.6% |
Source: New Jersey Multiple Listing Service, Inc #21035177 Report a problem | ||
| 6/4/2019 | Sold | $285,000 |
Source: Public Record Report a problem | ||
| 5/17/2019 | Listing removed | $2,400 |
Source: Better Homes and Gardens Rand Realty - Morristown #3546535 Report a problem | ||
| 4/11/2019 | Listed for rent | $2,400 |
Source: Better Homes and Gardens Rand Realty - Morristown #3546535 Report a problem | ||
| 3/22/2019 | Sold | $285,000+1.8% |
Source: GSMLS #3529958 Report a problem | ||
| 2/5/2019 | Listed for sale | $280,000+107.4% |
Source: KELLER WILLIAMS - NJ METRO GROUP #3529958 Report a problem | ||
| 11/14/2018 | Sold | $135,000-34.1% |
Source: Agent Provided Report a problem | ||
| 7/10/2018 | Listed for sale | -- |
Source: Auction.com Report a problem | ||
| 4/15/2016 | Sold | $205,000+485.7% |
Source: Public Record Report a problem | ||
| 10/2/2014 | Sold | $35,000-72% |
Source: GSMLS #3148248 Report a problem | ||
| 3/3/2014 | Listing removed | $124,900 |
Source: ERA Queen City Realty #2960781 Report a problem | ||
| 12/10/2013 | Listed for sale | $124,900-3.8% |
Source: ERA Queen City Realty #2960781 Report a problem | ||
| 8/4/2013 | Listing removed | $129,900 |
Source: ERA Queen City Realty #2960781 Report a problem | ||
| 10/16/2012 | Listed for sale | $129,900-6% |
Source: ERA Queen City Realty #2960781 Report a problem | ||
| 3/4/2004 | Sold | $138,250+7.6% |
Source: Public Record Report a problem | ||
| 7/24/2001 | Sold | $128,500+97.7% |
Source: Public Record Report a problem | ||
| 8/1/2000 | Sold | $65,000-53.6% |
Source: Public Record Report a problem | ||
| 8/14/1997 | Sold | $140,000 |
Source: Public Record Report a problem | ||
Public tax history
| Year | Property taxes | Tax assessment |
|---|---|---|
| 2025 | $16,777 +3.1% | $416,300 |
| 2024 | $16,277 +12.8% | $416,300 |
| 2023 | $14,429 +7.7% | $416,300 |
| 2022 | $13,398 +3.1% | $416,300 +79.6% |
| 2021 | $12,997 +5.5% | $231,800 |
| 2020 | $12,320 +101.2% | $231,800 +98% |
| 2019 | $6,124 | $117,100 |
| 2018 | $6,124 +9.5% | $117,100 |
| 2017 | $5,595 +2.7% | $117,100 |
| 2016 | $5,449 +4.6% | $117,100 |
| 2015 | $5,210 -26.3% | $117,100 |
| 2014 | $7,065 +4.3% | $117,100 -38.6% |
| 2013 | $6,774 +3% | $190,700 |
| 2012 | $6,579 +12% | $190,700 |
| 2011 | $5,872 -4.9% | $190,700 |
| 2010 | $6,177 +9.8% | $190,700 |
| 2009 | $5,628 +1.4% | $190,700 |
| 2008 | $5,549 +4.7% | $190,700 |
| 2007 | $5,301 | $190,700 +2018.9% |
| 2006 | -- | $9,000 |
| 2005 | -- | $9,000 |
| 2004 | -- | $9,000 |
| 2003 | -- | $9,000 |
| 2002 | -- | $9,000 |
Find assessor info on the county website
Monthly payment
Est. payment
Payment breakdown
Explore the cost of this home by adjusting the details. Changes won't be saved.Climate risks
Neighborhood: 07050

Similar homes
- $550,0005 bd3 ba1.9k sqft58 N Jefferson St, City Of Orange Twp., NJ 07050For Sale
 MLS ID #4060538, Michele Joseph, Keller Williams Integrity. GSMLS
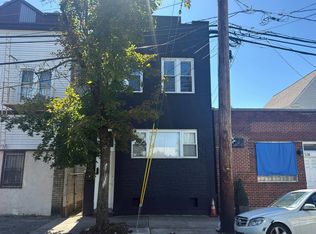
- $--6 bd4 ba2.5k sqft536 Joyce St, Orange, NJ 07050Auction
 Auction.com 2
- $569,9004 bd2 ba-- sqft137 S Day St, City Of Orange Twp., NJ 07050For Sale
 MLS ID #4059328, Suselle Salermo, Re/Max First Realty Ii. GSMLS
- $585,0004 bd2 ba-- sqft293 Ogden St, City Of Orange Twp., NJ 07050For Sale
 MLS ID #4058980, Tyeas Davis, Exp Realty, Llc. GSMLS
- $499,9995 bd4 ba2.3k sqft392 Berkeley Road, Orange, NJ 07050For Sale
 MLS ID #22633667, Jasmin Bracero, American Homes Group. MoreMLS
