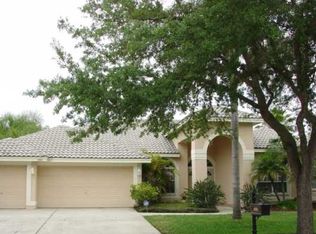
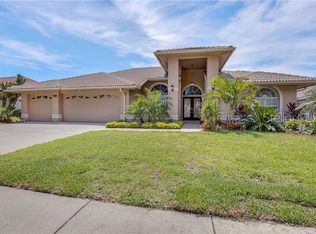
Desirable East Lake Woodlands, great floor plan for the active families
This property is off market, which means it's not currently listed for sale or rent on Zillow. This may be different from what's available on other websites or public sources.
$658,800
$619,000 - $698,000
$3,911/mo
$3,911/mo
Rent Zestimate®
Find your next renter with Zillow Rental Manager. Plus, with online applications, you can quickly screen prospective tenants – for free.
$3,911/mo
Rent Zestimate®
$4,596/mo
Est. payment
Refinancing to a lower rate could help reduce your monthly payments and save thousands over the life of the loan.
$4,596/mo
Est. payment
Work with a Zillow partner agent
Leverage their expertise and Zillow's premium Showcase listings to get your home seen by more buyers.
Get startedList with your own agent
Get your home in front of millions of buyers by listing it on Zillow.
Learn how to do itSell it yourself
Take full control of how buyers see your home on Zillow by listing For Sale by Owner (FSBO).
List your homeDesirable East Lake Woodlands, great floor plan for the active families
This property is off market, which means it's not currently listed for sale or rent on Zillow. This may be different from what's available on other websites or public sources.
| Date | Event | Price |
|---|---|---|
| 3/4/2015 | Sold | $331,000-10.5%$146/sqft |
Source: Stellar MLS #U7707471 Report a problem | ||
| 1/22/2015 | Price change | $369,737+5.7%$163/sqft |
Source: RE/MAX REALTEC GROUP #U7707471 Report a problem | ||
| 12/2/2014 | Price change | $349,737-5.4%$154/sqft |
Source: RE/MAX REALTEC GROUP #U7707471 Report a problem | ||
| 10/22/2014 | Price change | $369,737-2.6%$163/sqft |
Source: RE/MAX REALTEC GROUP #U7707471 Report a problem | ||
| 9/17/2014 | Price change | $379,737-5%$167/sqft |
Source: RE/MAX REALTEC GROUP #U7707471 Report a problem | ||
| 8/21/2014 | Listed for sale | $399,737+44.5%$176/sqft |
Source: RE/MAX REALTEC GROUP INC. #U7707471 Report a problem | ||
| 7/22/2014 | Sold | $276,675-7.4%$122/sqft |
Source: Stellar MLS #U7622525 Report a problem | ||
| 6/26/2014 | Price change | $298,700+91.5%$132/sqft |
Source: RE/MAX REALTEC GROUP #U7622525 Report a problem | ||
| 6/13/2014 | Price change | $156,000-47.8%$69/sqft |
Source: HomeSearch.com Realty Services Inc #U7622525 Report a problem | ||
| 6/10/2014 | Listed for sale | $298,700+17.1%$132/sqft |
Source: RE/MAX REALTEC GROUP #U7622525 Report a problem | ||
| 4/21/2012 | Listing removed | $255,000$112/sqft |
Source: Wilson Realty #U7531920 Report a problem | ||
| 4/12/2012 | Price change | $255,000+2.4%$112/sqft |
Source: Wilson Realty #U7531920 Report a problem | ||
| 1/4/2012 | Price change | $249,000-16.7%$110/sqft |
Source: Wilson Realty #U7531920 Report a problem | ||
| 12/31/2011 | Price change | $299,000-6%$132/sqft |
Source: Wilson Realty #U7531920 Report a problem | ||
| 12/29/2011 | Price change | $318,000-0.3%$140/sqft |
Source: Wilson Realty #U7531920 Report a problem | ||
| 11/30/2011 | Listed for sale | $319,000+10%$141/sqft |
Source: Wilson Realty #U7531920 Report a problem | ||
| 6/9/2011 | Listing removed | $289,900$128/sqft |
Source: Wilson Realty #U7514740 Report a problem | ||
| 5/25/2011 | Listed for sale | $289,900-28.4%$128/sqft |
Source: Wilson Realty #U7514740 Report a problem | ||
| 6/1/2005 | Sold | $405,000+24.2%$179/sqft |
Source: Public Record Report a problem | ||
| 10/30/2003 | Sold | $326,000+35.8%$144/sqft |
Source: Public Record Report a problem | ||
| 4/29/1998 | Sold | $240,000+321.8%$106/sqft |
Source: Public Record Report a problem | ||
| 4/5/1996 | Sold | $56,900$25/sqft |
Source: Public Record Report a problem | ||
| Year | Property taxes | Tax assessment |
|---|---|---|
| 2024 | $4,471 +1.9% | $288,024 +3% |
| 2023 | $4,390 +2.9% | $279,635 +3% |
| 2022 | $4,266 -1.2% | $271,490 +3% |
| 2021 | $4,316 +0.2% | $263,583 +1.4% |
| 2020 | $4,306 +1.7% | $259,944 +2.3% |
| 2019 | $4,232 | $254,100 +1.9% |
| 2018 | $4,232 +1.4% | $249,362 +2.1% |
| 2017 | $4,176 -32% | $244,233 -18.4% |
| 2016 | $6,138 +3.2% | $299,279 +5.6% |
| 2015 | $5,947 +44.5% | $283,412 +21.1% |
| 2014 | $4,116 +1.7% | $234,038 +1.5% |
| 2013 | $4,047 +5.4% | $230,579 +1.7% |
| 2012 | $3,840 | $226,725 -4.3% |
| 2011 | -- | $236,820 +1.5% |
| 2010 | -- | $233,320 -13.4% |
| 2009 | -- | $269,425 -11.7% |
| 2008 | $5,199 | $305,200 -15.6% |
| 2007 | -- | $361,825 +24.5% |
| 2005 | -- | $290,700 +8.8% |
| 2004 | $5,263 +37.1% | $267,300 +7.9% |
| 2003 | $3,839 +6.3% | $247,800 +2.4% |
| 2002 | $3,613 | $242,100 +7.1% |
| 2001 | $3,613 +6.5% | $226,000 +14.7% |
| 2000 | $3,393 | $197,000 |
Find assessor info on the county website