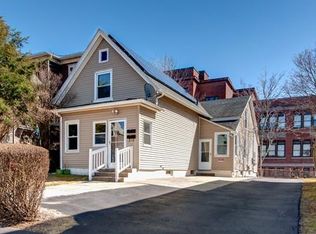
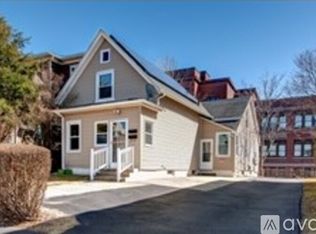
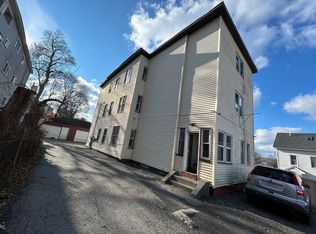
Expansive three family and a single family home being sold together close to the heart of Worcester! This property features original character, plenty of space and proximity to downtown Worcester & the highway. The single family home offers 4 bedrooms and 1 full bath, then each unit of the triple decker offers 3 bedrooms and 1 full bath. Each unit includes separate laundry rooms and storage space. Many updates have been completed in the interior of the units. This is definitely not a drive by.
For sale
$800,000
49 Richland St, Worcester, MA 01610
13beds
4,940sqft
4 Family
Built in 1890
-- sqft lot
$563,600 Zestimate®
$162/sqft
$-- HOA
What's special
Original character
- 8 days
- 214
- 26
Zillow last checked:
Listing updated:
Listed by:
The Riel Estate Team 774-200-8697,
Keller Williams Pinnacle Central 508-754-3020,
Nathan Riel 774-200-8697
Source: MLS PIN,MLS#: 73599316
Facts & features
Interior
Bedrooms & bathrooms
- Bedrooms: 13
- Bathrooms: 4
- Full bathrooms: 4
Heating
- Natural Gas
Appliances
- Included: Range, Refrigerator, Washer, Dryer
Features
- Living Room, Kitchen, Laundry Room
- Basement: Full,Unfinished
- Has fireplace: No
Interior area
- Total structure area: 4,940
- Total interior livable area: 4,940 sqft
- Finished area above ground: 4,940
Property
Parking
- Parking features: Off Street
Features
- Patio & porch: Enclosed, Patio
Lot
- Size: 4,330 Square Feet
- Features: Gentle Sloping
Details
- Parcel number: M:05 B:019 L:00009
- Zoning: RG-5
Construction
Type & style
- Home type: MultiFamily
- Property subtype: 4 Family
Materials
- Foundation: Brick/Mortar
- Roof: Shingle,Slate
Condition
- Year built: 1890
Utilities & green energy
- Sewer: Public Sewer
- Water: Public
Community & HOA
Community
- Features: Public Transportation, House of Worship, Private School, Public School
Location
- Region: Worcester
Financial & listing details
- Price per square foot: $162/sqft
- Tax assessed value: $573,700
- Annual tax amount: $7,567
- Date on market: 11/5/2026
- Total actual rent: 0
Estimated market value
$563,600
$507,000 - $614,000
$2,574/mo
Price history
| Date | Event | Price |
|---|---|---|
| 11/5/2026 | Listed for sale | $800,000$162/sqft |
Source: MLS PIN #73599316 Report a problem | ||
| 8/22/2026 | Listing removed | $800,000$162/sqft |
Source: MLS PIN #73437153 Report a problem | ||
| 8/22/2026 | Listed for sale | $800,000$162/sqft |
Source: MLS PIN #73437153 Report a problem | ||
| 6/2/2026 | Pending sale | $800,000$162/sqft |
Source: MLS PIN #73437153 Report a problem | ||
| 9/30/2025 | Listed for sale | $800,000$162/sqft |
Source: MLS PIN #73437153 Report a problem | ||
Public tax history
| Year | Property taxes | Tax assessment |
|---|---|---|
| 2025 | $7,567 +7.7% | $573,700 +12.3% |
| 2024 | $7,026 +12.9% | $511,000 +17.7% |
| 2023 | $6,225 +8.2% | $434,100 +14.8% |
| 2022 | $5,751 +10.9% | $378,100 +18.7% |
| 2021 | $5,185 +18.3% | $318,500 +23.5% |
| 2020 | $4,383 -0.9% | $257,800 +5% |
| 2019 | $4,421 +1.8% | $245,600 +6.9% |
| 2018 | $4,344 +6% | $229,700 +7.7% |
| 2017 | $4,098 -12.3% | $213,200 -6% |
| 2016 | $4,672 +2.7% | $226,700 |
| 2015 | $4,550 +2.7% | $226,700 |
| 2014 | $4,430 +2.9% | $226,700 -2.2% |
| 2013 | $4,307 +2.9% | $231,800 -6% |
| 2012 | $4,187 +0.8% | $246,600 -10.1% |
| 2010 | $4,154 +20.1% | $274,200 +7% |
| 2009 | $3,460 -13.5% | $256,300 -19.6% |
| 2008 | $3,999 +10.4% | $318,900 +6.5% |
| 2007 | $3,623 +7.3% | $299,400 +11.1% |
| 2006 | $3,376 +22.8% | $269,400 +29.1% |
| 2005 | $2,749 +16.9% | $208,600 +30.9% |
| 2004 | $2,351 +9.7% | $159,400 +20.2% |
| 2003 | $2,143 -8.6% | $132,600 +1% |
| 2002 | $2,344 +22.6% | $131,300 +26.9% |
| 2000 | $1,912 +0.6% | $103,500 +1.7% |
| 1997 | $1,901 | $101,800 |
Find assessor info on the county website
Monthly payment
Est. payment
Payment breakdown
Explore the cost of this home by adjusting the details. Changes won't be saved.Climate risks
Neighborhood: 01610
Similar homes
- $875,00012 bd3 ba3.5k sqft19 Perry Ave, Worcester, MA 01610For Sale
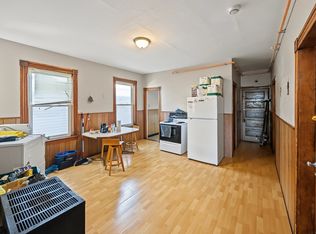 MLS ID #73586316, Brandon O'Neal, Coldwell Banker Realty - Worcester. MLS PIN
- $809,00011 bd4 ba4k sqft11 Glenwood St, Worcester, MA 01610For Sale
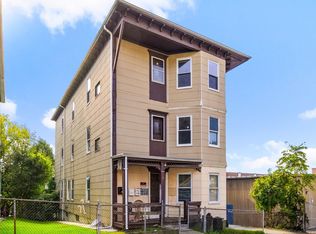 MLS ID #73585382, Jennifer Barrile, ERA Key Realty Services - Distinctive Group. MLS PIN
- $850,00012 bd3 ba5.3k sqft128 Beacon St, Worcester, MA 01610For Sale
 MLS ID #73586058, Elaine Evans Group, RE/MAX Generations. MLS PIN
- $815,00012 bd3 ba3.3k sqft7 Bluff St, Worcester, MA 01610For Sale
 MLS ID #73551331, Tai Cheng, La Maison. MLS PIN
